


Google Stock Forecast: TPU Growth Strengthens Alphabet’s Challenge to Nvidia
TradingKey - Alphabet (NASDAQ: GOOGL) closed at $337.83 on September 23, down 3.80% after posting a big reverse momentum candlestick. The recent correction provides a buying opportunity as we continue to see Alphabet innovate in several areas, especially with cloud and artificial intelligence. Funds are flowing into the cloud, and with recent contract wins, Alphabet is extending its AI infrastructure. Investor concerns lie with the pace of funding, and when will Google Cloud contract wins and profitability events occur?
TPUs Are Becoming a Larger Commercial Business
Google Cloud is also offering TPU rental services, and Alphabet is selling TPU systems. At the recent Goldman Sachs Communacopia + Technology Conference, Google Cloud CEO, Thomas Kurian, mentioned the TPU accelerator business is more than twice the size of the next-largest hyperscaler accelerator business. Kurian also stated that the AI servers have a payback period of less than two years, and Google Cloud’s in house processor has a payback period about half that of GPUs. It’s important to consider management estimates are just that, and may not be a reflection of the commercial revenue of TPU systems. As a result, it’s important to consider TPUs as a commercial offering.
Broadcom, Anthropic and Crux Add Capacity Visibility
Broadcom and Google have agreements for the development and supply of next-generation AI racks and TPUs up to 2031.
Anthropic will have access to approximately 3.5 gigawatts of TPU capacity beginning in 2027 through the expanded Google-Broadcom collaboration.
Though Anthropic’s access to TPUs is substantial, it does not guarantee Alphabet will recognize this revenue. There are other factors such as how quickly Alphabet ramps up its infrastructure and whether TPUs meet customer expectations.
Alphabet has TPU infrastructure projects beyond its direct control. For example, the $5 billion initial Blackstone equity commitment to a joint venture with Google aims to launch 500 megawatts of TPU capacity in 2027.
As with Anthropic’s access to TPUs, this project outlines planned TPU infrastructure and should not be viewed as revenue Alphabet recognizes.
TPU 8t and TPU 8i Strengthen the Product Roadmap
Google’s eighth-generation TPU line consists of TPU 8t for training and TPU 8i for inference and reinforcement learning.
TPU 8t is stated to provide 2.7x training performance per dollar compared to the previous generation, and TPU 8i provides 80% improved inference performance per dollar, compared to the previous generation.
Both are listed by Google Cloud as coming soon for customers.
It is important to understand the differences in computing needs for training and inference, and Google will likely focus its design for these workloads to provide further improvements in efficiency.
Google Cloud Growth Is Already Exceptional
Results from Alphabet’s Q2 report illustrate the impact of the TPU business. Sales for the quarter grew 24% to $119.8 billion. Google Cloud sales increased 82% to $24.8 billion. Cloud operating income increased to $8.81 billion from the prior year’s $2.83 billion. Strong sales within Alphabet’s core business, Search, benefited operation income and cash flows. Alphabet does not disclose the financial impact of TPU. Therefore, determining the financial impact of Cloud’s business growth is difficult. Contracts in Alphabet’s Cloud backlog increased to $513.9 billion from the previous quarter. Management expects to recognize just over 50% of the backlog over the next 24 months. While the backlog provides support to the long-term growth of the business, the timing of contract recognition is important to watch.
CapEx Is the Biggest Financial Risk
Alphabet’s capital expenditures (CapEx) more than doubled to $44.9 billion for the quarter. Cash flow from operations was $39.1 billion for the quarter. CapEx outpaced cash flow from Alphabet’s business operations.
Search continues to be a highly profitable business for Alphabet; however, Google Cloud was already profitable in Q2, with a 35.6% operating margin. Management said Q3 Cloud margins may face pressure from the use of third-party capacity and the Wiz integration.
Rapid Growth Comes at a Cost
Q2 CapEx rose to $44.9 billion from $22.4 billion a year earlier, while operating cash flow increased to $39.1 billion from $27.7 billion. Free cash flow was negative $5.9 billion.
Alphabet continues signing large Cloud infrastructure contracts, but investors need to watch whether utilization, contract conversion and Cloud operating income justify the fixed infrastructure costs.
Search profitability gives Alphabet substantial funding capacity, but sustained infrastructure spending will require Cloud and AI revenue to keep scaling.
Headline EPS Is Distorted by Investment Gains
Alphabet recorded GAAP diluted EPS of $9.11 for the quarter, with $6.26 of that amount coming from the net impact of equity securities gains.
Those gains will not be repeatable.
When thinking about Alphabet’s valuation, I would focus more so on operating income and free cash flow. I would consider the Cloud business and the core products and services in conjunction with headline EPS.
Alphabet Is Challenging Nvidia, Not Replacing It
Alphabet’s focus on AI, especially with regards to TPUs, is increasing their competitiveness in AI infrastructure and other related markets. Currently, there are no signs of this market becoming monopolistic.
Google has and continues to support Nvidia GPUs for their Cloud offerings. They plan to provide Cloud support for Nvidia’s more recent GPU offerings.
With Google Cloud and TPUs, Alphabet will capture customer cloud and AI computing workloads while continuing to support and sell differentiated AI Infrastructure.
There is more of an opportunity for both Alphabet and Nvidia to be competitive in this market rather than a replacement of one another.
Alphabet Technical Analysis: GOOGL Tests Rising Trendline as $327.98 Support Comes Into Focus
Alphabet closed yesterday at $337.83 after a large-magnitude daily reversal from the intraday high of $357.84. The 4 hourly time frame structure weakened after the price printed below the 4 hourly moving average which is located at $346.26. Price has since fallen and tested the rising trendline.
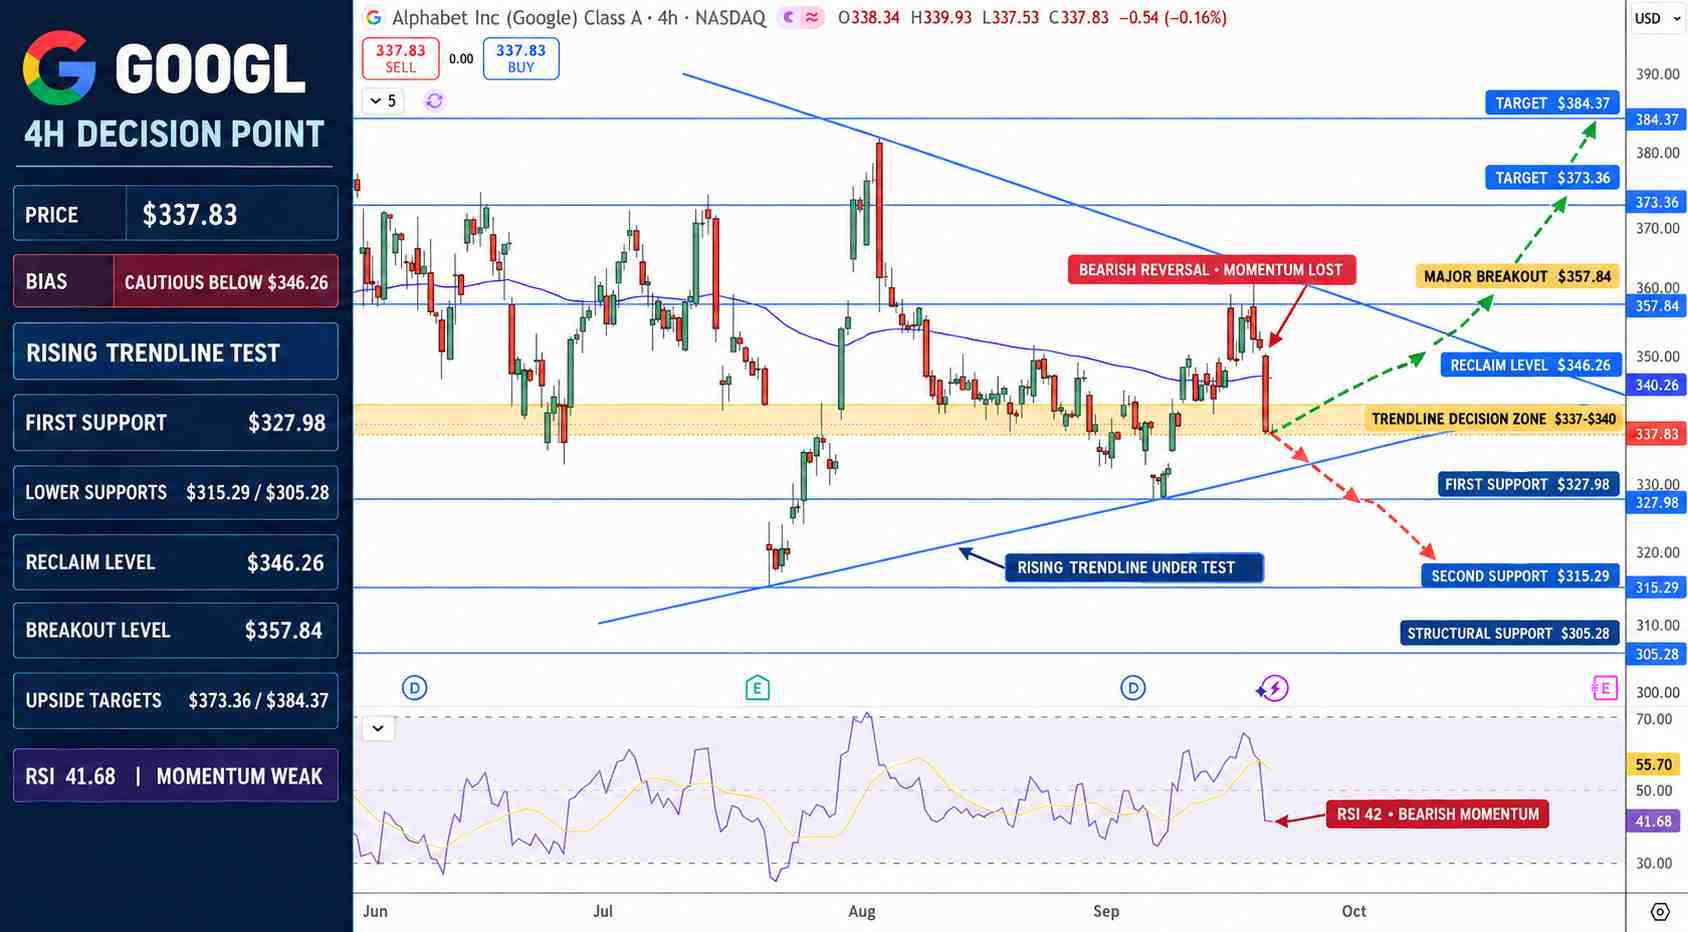
Google Stock Price Chart - Source: Tradingview
The 4-hour RSI has fallen to around 42, below its signal line near 56. Momentum has weakened, but RSI is not oversold.
337.00-340.00 is the first support to look for on the 4 hourly time frame. A decisive break below the 337-340 support structure would bring the next support at $327.98. Loss of the 327.98 support would bring the 315.29 and 305.28 levels into focus.
346.26 is the first resistance level to watch out for. The 357.84 level is the large resistance that must be broken to bring the next large level of resistance at 373.36 into play. I am looking for Alphabet to trade sideways between the 346.26 and 327.98 levels.
Why is Alphabet stock in focus now?
Since the transformation of Google’s TPU business to a larger commercial AI infrastructure platform, the spotlight has been on Alphabet. Q2 Google Cloud revenue showed a 82% increase. The Cloud business backlog was reported to be $513.9 billion. Recently announced long-term contracts by Google Cloud, including ones with Broadcom, Anthropic, and the Blackstone-backed Crux, further extend the TPU business runway.
What level confirms a stronger GOOGL recovery?
A continuation of the 4 hour trend to close above the $357.84 level would confirm a stronger breakout above the major resistance zone and increase the probability of a test of $373.36. A close below the rising trend line increases the risk of a move to the $327.98 level.
Bottom Line
Google is investing heavily in TPUs. In combination with the growth of Google Cloud, it demonstrates that infrastructure around AI is a significant and growing portion of the business.
Given the nature of Alphabet's business, it is capital-intensive, and there is the risk that the company will continue to spend significantly before the demand transforms to revenue. In Q2, it reported negative free cash flow.
From a more speculative standpoint, GOOGL could potentially rise above $357.84, but it currently remains below $346.26. If it fails to reclaim that level and breaks the rising trend line, $327.98 could potentially be reached.
Recommended Articles


