


TD SYNNEX Stock Outlook: AI Infrastructure Demand Puts Q3 Growth in Focus
TradingKey - TD SYNNEX (SNX) will report Q3 results on Thursday, September 24, 2026. The distributor of IT products is coming off an unusual quarter. As the report is issued before the market opens, we can gain insight into the momentum from Q2. Hyve Solutions was formed by SYNNEX in 2011 and is now a wholly owned subsidiary of TD SYNNEX, and it is clear that AI, cloud and digital infrastructures are positively impacting the company’s growth. While the distributor business continues to expand, the company must demonstrate to the investing community its ability to maintain gross profitability, especially as revenue increases.
Hyve Is Giving the Growth Story Real Substance
TD SYNNEX reported Hyve Solutions’ Q2 revenue of $2.97 billion, a 49% increase from the prior year period. Operating income increased 89% to $179 million, and operating margin improved to 6.03% from the prior year’s 4.75%
In my opinion, the operating results of Hyve Solutions are the most important operating results for the company. In Q3, TD SYNNEX needs to show it can continue the strong results it had in Q2. Q2 showed broad-based strength across both Distribution and Hyve, building on momentum from prior quarters. Investors can now see results from AI and cloud products and services.
Thus far, Hyve has become an increasingly important growth and profitability contributor within TD SYNNEX
New Nevada Capacity Supports the Longer-Term AI Thesis
In August, Hyve publicly announced plans to open two new campuses in Nevada. The new campuses will increase their capacity for advanced manufacturing.
The Reno campus will be 624,000 square feet. Together with the North Las Vegas site, the two campuses are expected to significantly expand Hyve’s U.S. advanced-manufacturing footprint and create about 3,000 jobs.
The expansion signals confidence in future customer demand. The risk will be in the public markets.
There is a strong likelihood new campuses will be drains on working capital until customer contracts are awarded.
Hyve has established a track record for customer attainment and attractive margins. The risk will be in the new campuses’ ability to absorb the working capital.
Q2 Delivered Record Growth
Revenue for Q2 was $19.6 billion, a 31% increase over the same period last year. Non-GAAP gross billings were $28.9 billion, a 33% increase from the prior year period. Adjusted diluted EPS was $4.85, a 62% increase. Gross margins contracted 16 basis points, but GAAP operating margins improved 45 basis points.
Rapid revenue growth was outpaced by even stronger improvements in operating profitability. Operating profit improvements may be difficult to repeat with similar magnitude if revenue growth normalizes or infrastructure costs increase.
Cash Flow Is the Main Quality Test
The biggest obstacle during the recent quarter was cash flow. Free cash flow was negative $332 million in the quarter, compared to positive $543 million in the same quarter last year. Growth consumables often require additional working capital. Negative quarters have historically occurred and do not change the long term outlook. The focus should be on cash flow.
If there is strong revenue and EPS growth this quarter, but there is a large buildup in working capital, then the quarter would not be considered a success.
Q3 Guidance Sets a Clear Benchmark
Revenue for this quarter is estimated to be between $18.2 and $19.0 billion. Non-GAAP gross billings are estimated between $27.2 and $28.2 billion. GAAP EPS is estimated to be between $3.40 and $3.90. The adjusted estimate is between $4.25 and $4.75. The estimated $18.6 billion revenue midpoint would be a quarter over quarter decline from the previous quarter, but an increase from the same quarter the previous year.
The consensus estimate for revenue is approximately $18.8 billion and the consensus estimate for adjusted EPS is approximately $4.68. These are estimate, not company, reported, or guidelines’ numbers. When reporting results for this quarter, what is more important is the company's outlook for the future, including the outlook for customer demand, and working capital.
Shareholder Returns Add Support
The North American information technology (IT) distributor TD SYNNEX announced that during the second quarter, it spent approximately $151 million on share buybacks and dividends.
We find capital returns to be important, but they will always be secondary to the results of the operations.
We believe that investors are betting on TD SYNNEX’s AI infrastructure to be a repeatable major driver of earnings and cash flow. With that in mind, we believe the current multiple assigned to the stock takes a bigger hit if that bet doesn’t pay off.
As of now, we believe the stock is relatively fairly valued.
What Would Change the Outlook
If the company reports positive results on Hyve’s growth and operating margin, and an improvement in free cash flow, we would take a more positive stance on the stock.
If results show gross margins come under further pressure, a significant growth-related investment is made, or Hyve’s growth decelerates, we would take a more negative view of the stock.
The best case scenario would be positive surprises on revenue and/or earnings and an improvement in cash conversion.
TD SYNNEX Technical Analysis: SNX Tests $287.66 as Rising Channel Drives Breakout
TD SYNNEX's latest closing price is $283.25, which is close to the chart price of $285.00. The 2 hour rising channel has been bullish since TD SYNNEX broke out above $269.16 and $277.16.
Prices have been forming a series of higher highs and higher lows. Currently prices have reached the upper resistance of the channel at $287.66.
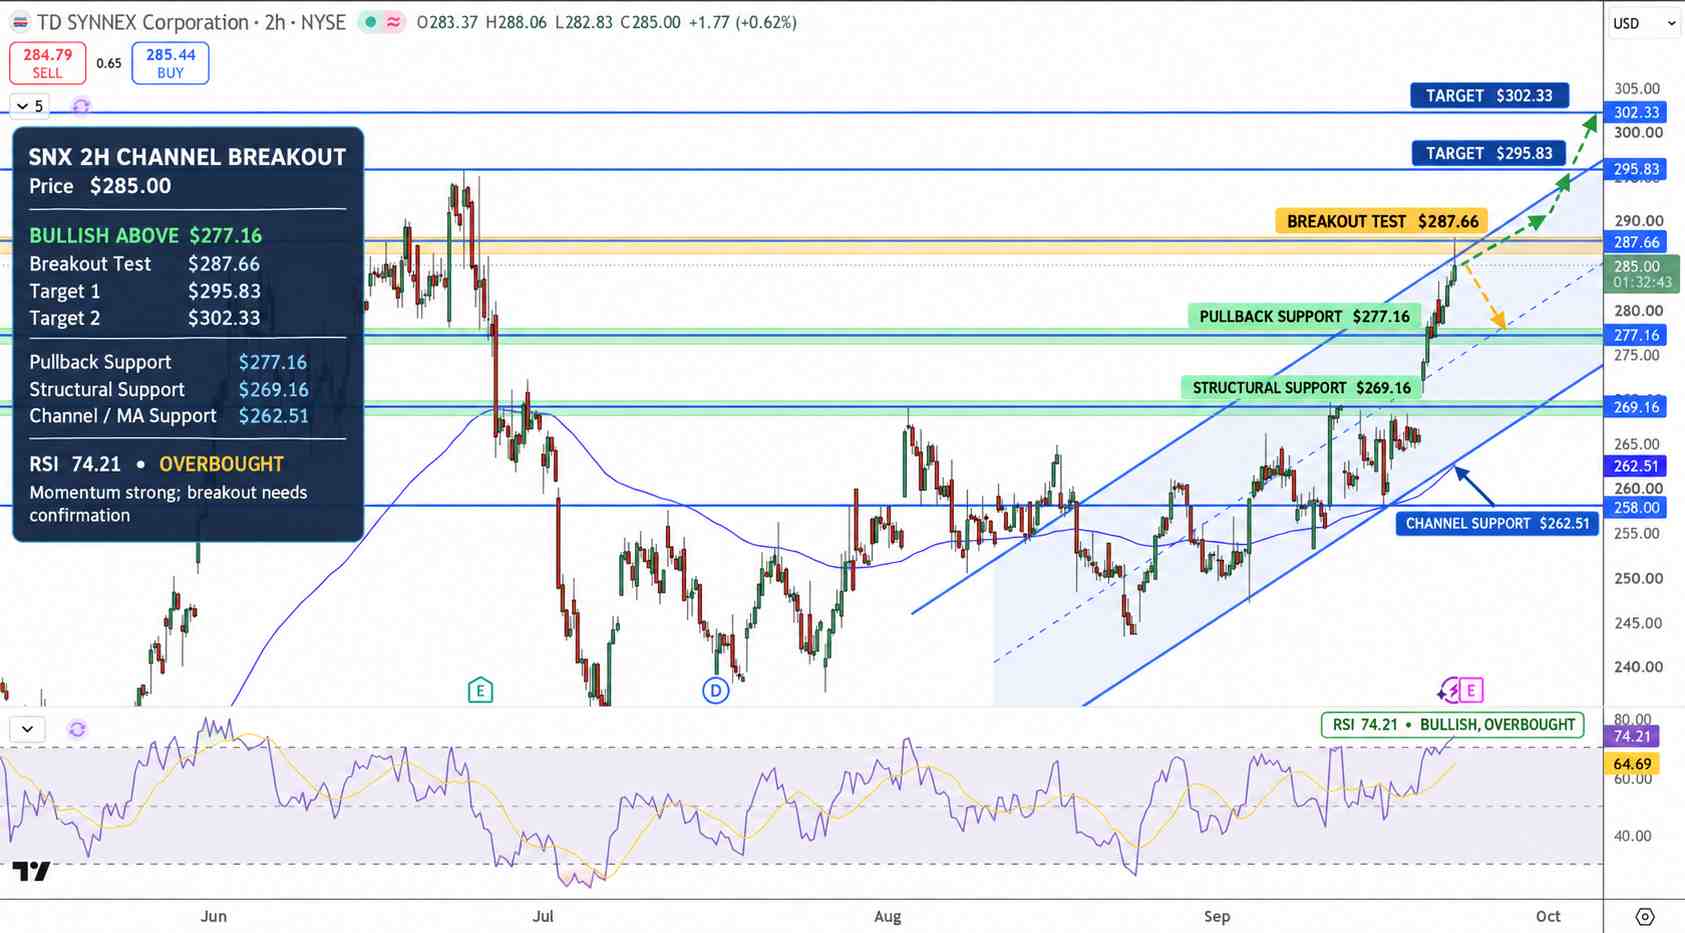
TD SYNNEX Stock Price Chart - Source: Tradingview
Rising prices have caused the Relative Strength Index (RSI) to climb to 74. With the RSI above the signal line, it shows that momentum is strong but pullback or consolidation risk is elevated.
A sustained 2-hour close above the resistance at $287.66 would confirm the next breakout and target $295.83. Prices above $295.83 are expected to continue to rise to $302.33.
There is support at $277.16 and $269.16. If price falls below $269.16, the rising channel and moving average near $262.51 provide the next support area.
I expect prices to remain bullish above $277.16. However, prices may gap after TD SYNNEX report earnings.
Key Levels
• Latest Close: $283.25
• Short Term Resistance: $287.66, $295.83, $302.33
• Long Term Support: $277.16, $269.16, $262.51
• RSI: 74
Why is TD SYNNEX stock in focus now?
TD SYNNEX will report Q3 results on Thursday before the market opens. Investors will look for signs of Hyve Solutions’ continued strong growth, as well as improvements in operating margins and cash flow from operations. They will also pay attention to see if management is optimistic about the ongoing trend of the AI infrastructure spending.
What level confirms a stronger SNX breakout?
In order for SNX to break out bullish, it needs to close at $287.66 or higher in the 2-hour time frame. If this happens, traders would look for a move higher to $295.83 and then $302.33. A move back below $277.16 would weaken the current bullish breakout structure.
Bottom Line
TD SYNNEX has a positive track record of recent earnings reports and continues to establish AI Infrastructure growth through Hyve.
The main risk is how strong is the AI infrastructure growth? In Q2, the company reported very strong top line results, but free cash flow was negative by $332 million, while operating cash flow was approximately negative $266 million.
The main trend for SNX is bullish as long as it trades above $277.16. The price of $287.66 acts as the first major hurdle for a larger up move.
Recommended Articles


