

Qualcomm Stock Price Forecast: Surges Over 20% in a Month as $200 Level Faces Make-or-Break Battle

Source Tradingkey

TradingKey - Qualcomm stock surges over 20% in the last 30 days; whether momentum can continue hinges on the $200 mark.

On September 24, Eastern Time, Qualcomm (QCOM) saw its stock rally hit resistance at the $200 mark, falling 1.4% in pre-market trading to trade at $194.47. Over the past 30 days (from late August through September), Qualcomm's stock demonstrated a strong rebound, surging rapidly from around $160 to the $198–$199 range, posting a single-month gain of 23%. However, as the stock price approaches the round-number threshold of $200, the market has entered a core battlefield for bulls and bears.

Qualcomm's major stock surge this time was primarily driven by multiple factors, including a major partnership with Amazon (AMZN)'s AWS, market recognition of its business transformation, and chip price increases. Effective September 1, Qualcomm implemented double-digit price hikes on select chip products, which the market expects will boost gross margins and profitability in subsequent quarters, supporting the stock rebound. On September 8, Qualcomm and Amazon announced a multi-generational custom chip partnership agreement, under which Qualcomm will supply custom chips and AI data center optical interconnect solutions for AWS's AI infrastructure, further driving the stock rebound higher.

In addition, Qualcomm reiterated at public events such as the Goldman Sachs Tech Conference that the revenue share from automotive chips and edge AI/IoT is rising rapidly, emphasizing its target for non-smartphone revenue to exceed $40 billion by FY2029. This bolstered investor confidence that even if Qualcomm faces future shifts in iPhone chip foundry arrangements, it can bridge the gap with automotive, PC, and AI data centers.

Currently, Qualcomm's stock price is consolidating and testing the $195–$199 range. The $200 level is not only a key psychological barrier, but also a strong Fibonacci 0.5 resistance level, as well as a critical battleground where trapped buyers from previous highs meet bullish and bearish trend decisions. If Qualcomm's stock can break through this level on heavy volume and hold above it for more than three consecutive trading days, it will confirm the opening of a new upward channel, with a target looking toward the all-time high of $260.
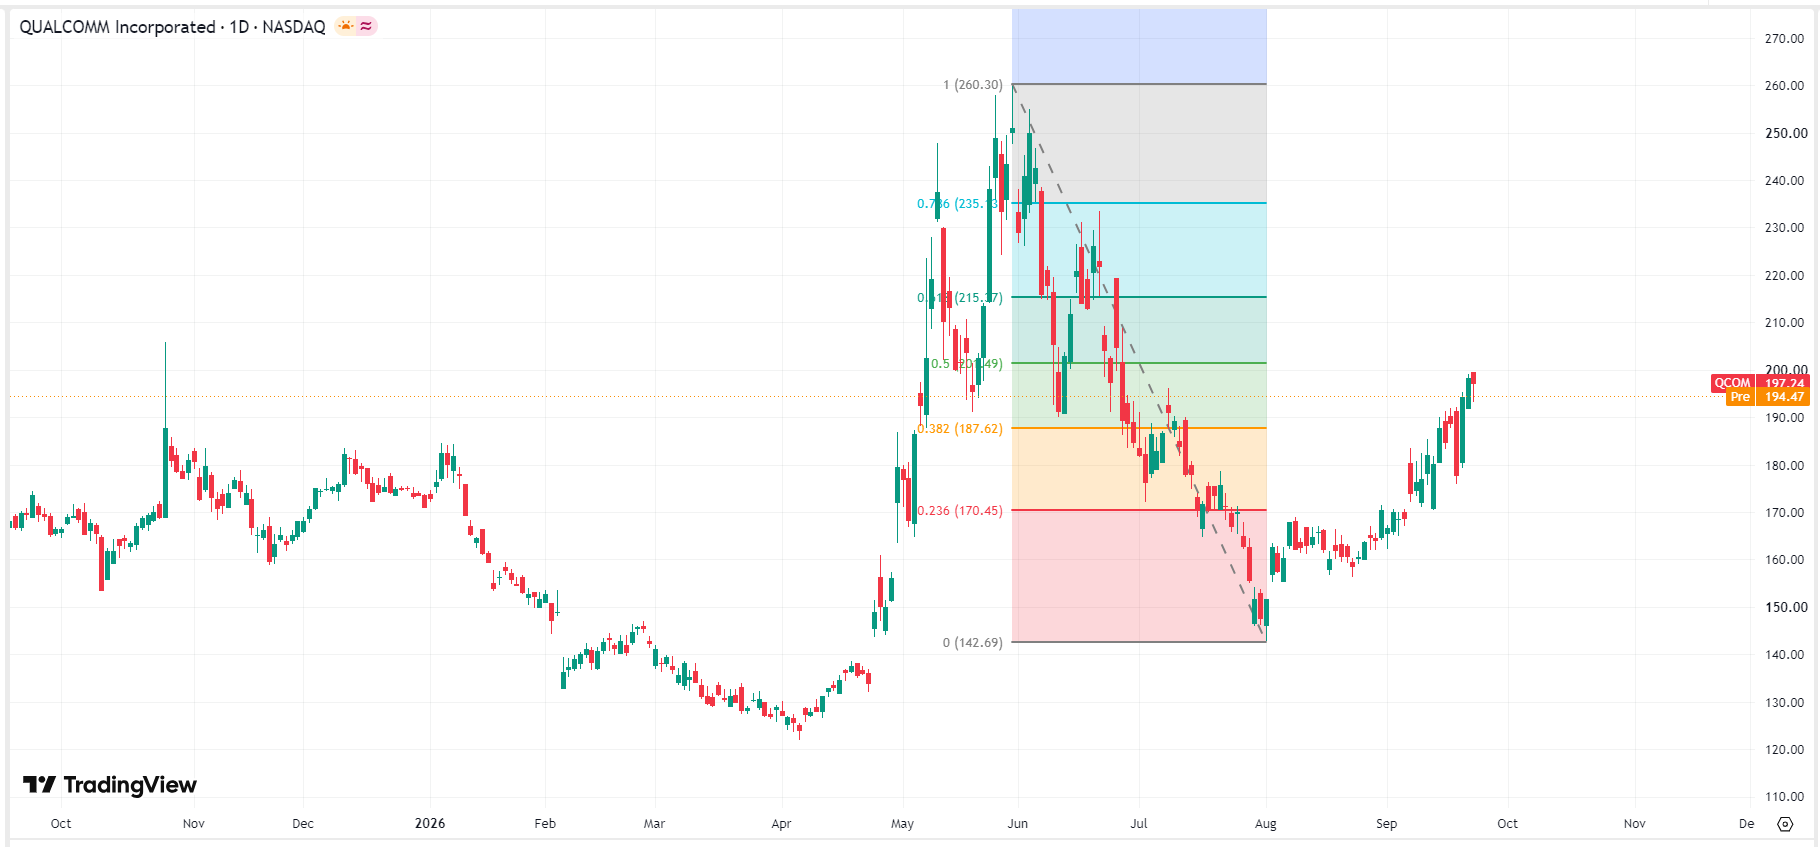
qcom-price-7ba033d027264be4a6f6904bc2e4b87dQualcomm stock price chart, Source: TradingView

However, if Qualcomm encounters strong selling pressure at the $200 mark and pulls back, its stock price may retest the $180–$182 range, which serves as a support line near the September breakout point and offers a buy-on-dips entry point with a higher margin of safety. If a deeper correction breaks below the $170 stop-loss level, it would signal an end to this sharp rally, warning of a potential slide toward the August low of $140.

Disclaimer: For information purposes only. Past performance is not indicative of future results.
placeholder
WTI (USOIL) Is down 2.03% on Sep 25: Here Is WhyWTI (USOIL) is down 2.03% at Sep 24 22:20(UTC+0), now at $92.517, with a 7-day down of 3.63%.What is driving WTI (USOIL)’s stock price down today?The drop in WTI crude oil prices was primarily driven by
Author  TradingKey
12 hours ago
WTI (USOIL) is down 2.03% at Sep 24 22:20(UTC+0), now at $92.517, with a 7-day down of 3.63%.What is driving WTI (USOIL)’s stock price down today?The drop in WTI crude oil prices was primarily driven by
placeholder
Silver Price Forecast: XAG/USD remains steady near $64.00 as oil prices easeSilver price (XAG/USD) inches higher after two days of losses, trading around $63.90 per troy ounce during Asian hours on Friday. Non-yielding Silver is finding underlying support as inflation concerns ease following a pullback in crude oil prices.
Author  FXStreet
13 hours ago
Silver price (XAG/USD) inches higher after two days of losses, trading around $63.90 per troy ounce during Asian hours on Friday. Non-yielding Silver is finding underlying support as inflation concerns ease following a pullback in crude oil prices.
placeholder
Gold Price Forecast: Gold Drops Below $4,300, Will It Continue to Fall? As of the European session on September 24, gold prices (XAUUSD) extended their correction, dipping below $4,300 intraday to hit a low of $4,262.45. After previously rebounding close to $
Author  TradingKey
Yesterday 09: 57
As of the European session on September 24, gold prices (XAUUSD) extended their correction, dipping below $4,300 intraday to hit a low of $4,262.45. After previously rebounding close to $
placeholder
Yen touches 158.37 as Tokyo reopens, then slips back — ¥15.4 trillion of intervention and the 200-day line stand between here and 160USD/JPY reached 158.37 overnight, its highest since early September, then eased to 157.88 as Japanese markets reopened after a three-day holiday. The Ministry of Finance has spent ¥15.4 trillion defending the yen since late July and the BOJ ran a rate check on September 18. The 200-day average sits at 158.43.
Author  Irene Q.
Yesterday 06: 59
USD/JPY reached 158.37 overnight, its highest since early September, then eased to 157.88 as Japanese markets reopened after a three-day holiday. The Ministry of Finance has spent ¥15.4 trillion defending the yen since late July and the BOJ ran a rate check on September 18. The 200-day average sits at 158.43.
placeholder
US input costs rose at the fastest pace in four years — the September flash PMI beat is an inflation story, not a growth storyUS September flash PMIs came in far above expectations, with the composite at 58.4, a five-year high. But the detail that moved markets was input cost inflation at its fastest since October 2022, driven by fuel, transport and supply shortages. Brent is back above $100 and the 10-year Treasury yield has hit its highest since 2007.
Author  Suzie
Yesterday 06: 46
US September flash PMIs came in far above expectations, with the composite at 58.4, a five-year high. But the detail that moved markets was input cost inflation at its fastest since October 2022, driven by fuel, transport and supply shortages. Brent is back above $100 and the 10-year Treasury yield has hit its highest since 2007.
goTop
quote