

Nvidia Stock Forecast: Jensen Huang Says Chip Sales Will Double by 2027, NVDA Stock Could Challenge $320

Source Tradingkey

TradingKey - As of September 17, Eastern Time, driven by Jensen Huang's latest positive comments regarding AI chip demand, Nvidia (NVDA) stock opened higher and moved higher, rising 2.54% on the day to close at $219.34, ending its pullback since September 8.

Jensen Huang Expects Chip Sales to Double Next Year as AI Demand Has Yet to Peak

Nvidia CEO Jensen Huang stated on September 17 during an AI summit in Scotland that the company expects the volume of chips it sells next year to double compared to this year. He noted that AI is creating increasingly visible value across various industries and economies, with multiple countries around the world still seeking to increase their AI investments. Although Nvidia did not disclose specific chip sales figures, management believes that demand for AI hardware will continue to expand at a rapid pace over the coming year.

Notably, Nvidia previously projected that its revenue for fiscal year 2028 would still grow by approximately 70%, and explicitly stated that this forecast was provided under supply constraints, implying that actual customer demand may exceed the scale currently deliverable.

The next-generation Vera Rubin is also becoming a key pillar for the company's next phase of growth. Nvidia's latest MLPerf benchmark results show that the Vera Rubin NVL72 achieves up to 3.7 times the throughput of the GB300 NVL72 in certain AI inference tasks. Rubin has entered volume production, and as the new platform gradually succeeds Blackwell, the company is poised to continue benefiting from capital expenditures by major cloud hyperscalers, AI model developers, and sovereign AI projects.

For NVDA's stock price, Huang's remarks help ease recent market concerns about AI investment peaking. However, whether the stock can sustain its upward trajectory depends on two key factors: first, whether the supply of GPUs and advanced packaging can meet demand; and second, profitability. Due to rapidly rising memory costs, Nvidia expects its Q3 gross margin to be around 74%, which could drop to 71%–72% in Q4. Consequently, even if sales volumes surge significantly in the future, the market will remain focused on whether revenue growth can translate into equally robust profit growth.

Nvidia Stock Price Technical Analysis
nvda-ae0594910fe5451296a8a1660ddd379a

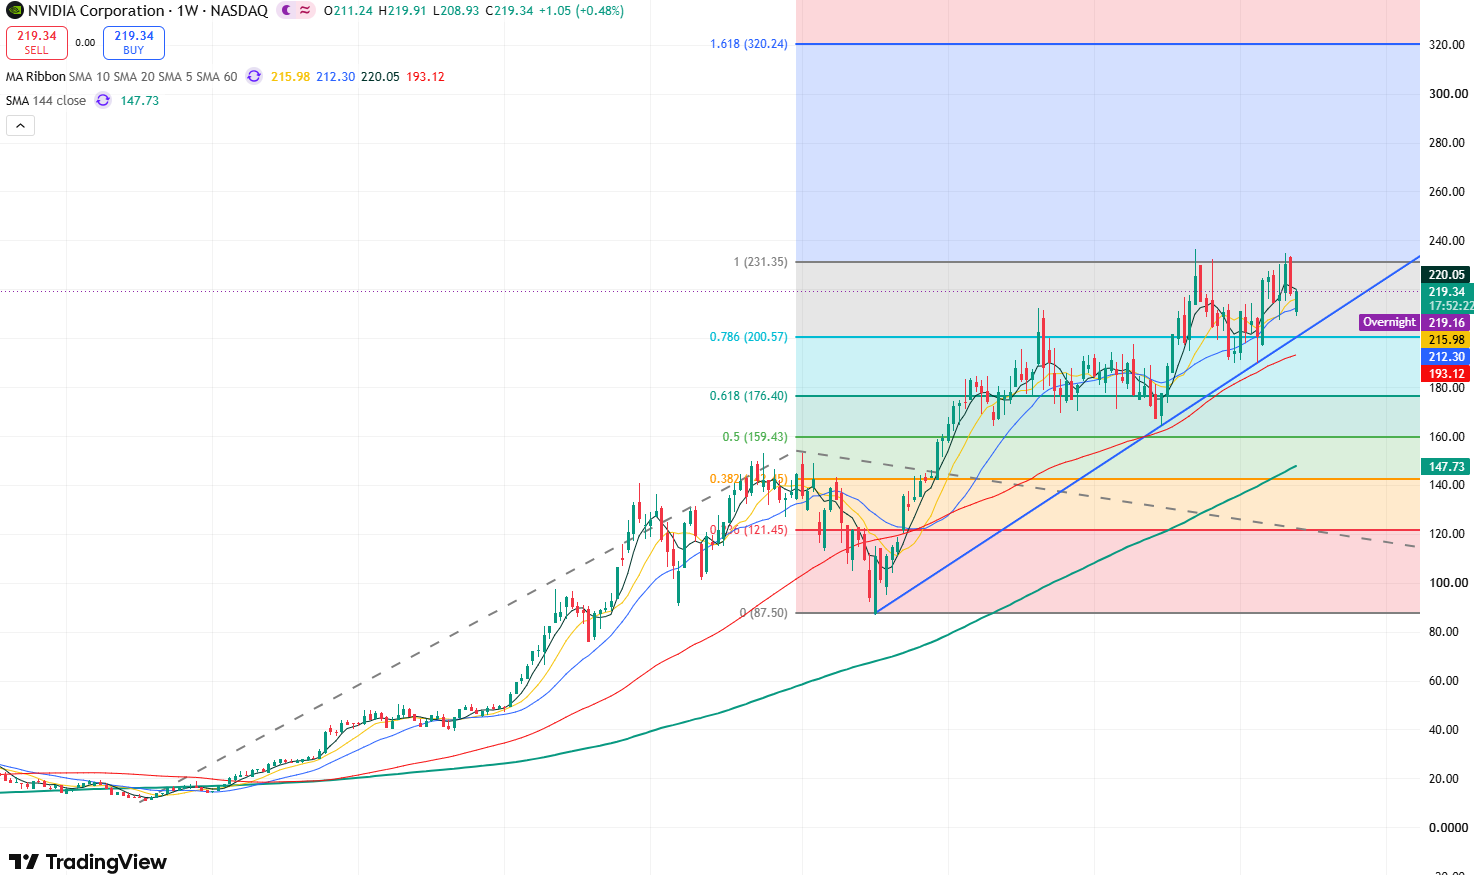
Nvidia stock price weekly chart, Source: TradingView

Looking at Nvidia's weekly chart, connecting the candlestick lows from April to the present forms a clear upward trendline, indicating an overall bullish trend; meanwhile, the SMA60 and SMA144 medium-to-long-term moving averages maintain a bullish alignment, demonstrating strong momentum in the uptrend and a high probability of further gains.

Currently, the stock price has attempted twice to test $230 without a decisive breakthrough, prompting a recent pullback. However, market sentiment was lifted after Jensen Huang's remarks, and the stock is expected to close higher this week and halt the decline, implying that short-term stock prices may continue to rise.

On the upside, the primary resistance level to watch is $230-$236.5. If the stock price can break above $236.5 to set a new record high, it will open up upside room toward the 1.618 Fibonacci extension level at $320.

On the downside, the primary support level to watch is $208, followed by around $200. If this level fails to hold, the stock may enter a deeper correction phase, potentially testing support at $190 or even falling toward around $176.

Disclaimer: For information purposes only. Past performance is not indicative of future results.
placeholder
Fed hike odds near 90% into Wednesday's decision — how to trade the dollar, gold and the S&P 500A 0.3% monthly core CPI print has lifted the market-implied probability of a 25bp Fed hike on 16 September to roughly 86.5% ~ 90%, which would be the first increase since July 2023. Here is the decision timeline, the pricing versus the forecasts, both scenarios, and the key levels for the dollar, gold and the S&P 500.
Author  Suzie
Sep 14, Mon
A 0.3% monthly core CPI print has lifted the market-implied probability of a 25bp Fed hike on 16 September to roughly 86.5% ~ 90%, which would be the first increase since July 2023. Here is the decision timeline, the pricing versus the forecasts, both scenarios, and the key levels for the dollar, gold and the S&P 500.
placeholder
Silver breaks $64 as precious metals rebound — can gold hold the $4,280 line into the Fed decision?Silver has climbed back above $64 an ounce for the first time this week, leading a broad rebound across precious metals hours before the Federal Reserve delivers what is expected to be its first rate hike since 2023. Spot silver was last at $64.64, up 1.49% on the day, while gold reclaimed $4,300 and platinum and palladium both advanced. The question now is whether the bounce is a genuine turn — or a pause before the Fed's dot plot decides the next move.
Author  Suzie
Sep 16, Wed
Silver has climbed back above $64 an ounce for the first time this week, leading a broad rebound across precious metals hours before the Federal Reserve delivers what is expected to be its first rate hike since 2023. Spot silver was last at $64.64, up 1.49% on the day, while gold reclaimed $4,300 and platinum and palladium both advanced. The question now is whether the bounce is a genuine turn — or a pause before the Fed's dot plot decides the next move.
placeholder
Bitcoin falls below $75,000 as the CLARITY Act fails in the Senate — what the vote means for cryptoThe US Senate blocked the Digital Asset Market CLARITY Act in a 49-50 procedural vote, sending Bitcoin briefly below $75,000 — its biggest one-day drop since June. Ethereum fell more than 8%, Coinbase slid 10% and $75 billion of crypto market value evaporated. Here is what the vote was, why it failed, and the levels that matter now.
Author  Suzie
Sep 16, Wed
The US Senate blocked the Digital Asset Market CLARITY Act in a 49-50 procedural vote, sending Bitcoin briefly below $75,000 — its biggest one-day drop since June. Ethereum fell more than 8%, Coinbase slid 10% and $75 billion of crypto market value evaporated. Here is what the vote was, why it failed, and the levels that matter now.
placeholder
Dow drops 631 points as the Fed hikes — but futures are rebounding: what's next for US stocks?The Dow fell 631 points and the S&P 500 closed below 7,600 after the Fed hiked rates for the first time since 2023, with the dot plot showing 16 of 18 officials expect more tightening. Asia-session futures are already recovering — here are the levels and analyst views that decide whether 7,500 holds.
Author  Irene Q.
Yesterday 02: 54
The Dow fell 631 points and the S&P 500 closed below 7,600 after the Fed hiked rates for the first time since 2023, with the dot plot showing 16 of 18 officials expect more tightening. Asia-session futures are already recovering — here are the levels and analyst views that decide whether 7,500 holds.
placeholder
Dollar index tops 100 for the first time since July as the Fed's hawkish dot plot sinks inThe U.S. dollar index broke back above 100 for the first time since 31 July after the Fed delivered its first rate hike since 2023, with the dot plot showing 16 of 18 officials expect at least one more increase this year. Here are the levels that matter for DXY, the currencies feeling it most, and what to watch next.
Author  Irene Q.
Yesterday 02: 45
The U.S. dollar index broke back above 100 for the first time since 31 July after the Fed delivered its first rate hike since 2023, with the dot plot showing 16 of 18 officials expect at least one more increase this year. Here are the levels that matter for DXY, the currencies feeling it most, and what to watch next.
goTop
quote