


SpaceX Stock Price Forecast: Can SPCX Unlock Further Upside as Starship Nears First Orbital Flight?
TradingKey - SpaceX (SPCX) announced on September 15 local time that the 14th Starship test flight will take place as early as September 22, aiming to put the spacecraft into Earth's orbit for the first time.
According to the plan released by SpaceX, the approximately 407-foot-tall Starship system will lift off from Starbase in Texas. The upper-stage spacecraft is expected to enter an orbit approximately 275 kilometers high and complete six orbits around Earth, with the entire mission lasting nearly 10 hours before making a controlled splashdown in the Pacific Ocean. Previous tests primarily used suborbital trajectories; if this mission succeeds, it will mark Starship's official transition to an orbital testing phase closer to commercial operations.
This flight will also deploy 26 operational Starlink V3 satellites for the first time. The new generation of satellites features larger dimensions and greater capacity, relying primarily on Starship for batch launches. If the deployment goes smoothly, SpaceX will be able to expand Starlink's network capacity faster and reduce launch costs per unit of bandwidth.
However, successfully reaching orbit is only the first step.
SpaceX has already invested more than $15 billion in Starship and plans to build a new dedicated spaceport in Louisiana. Ultimately, the company needs to demonstrate that both the Super Heavy booster and the upper-stage spacecraft can be rapidly recovered, refurbished at low cost, and relaunched to generate a reasonable return on these massive investments.
Jeffrey Wlodarczak, an analyst at Pivotal Research Group, believes that the investment value of the Starship program depends almost entirely on whether full reusability can be achieved. This mission will not attempt to catch the upper-stage spacecraft using the launch tower, and issues such as thermal protection systems, engine reliability, orbital refueling, and regulatory approvals still need to be addressed in subsequent tests.
SpaceX Stock Technical Analysis
Source: TradingView
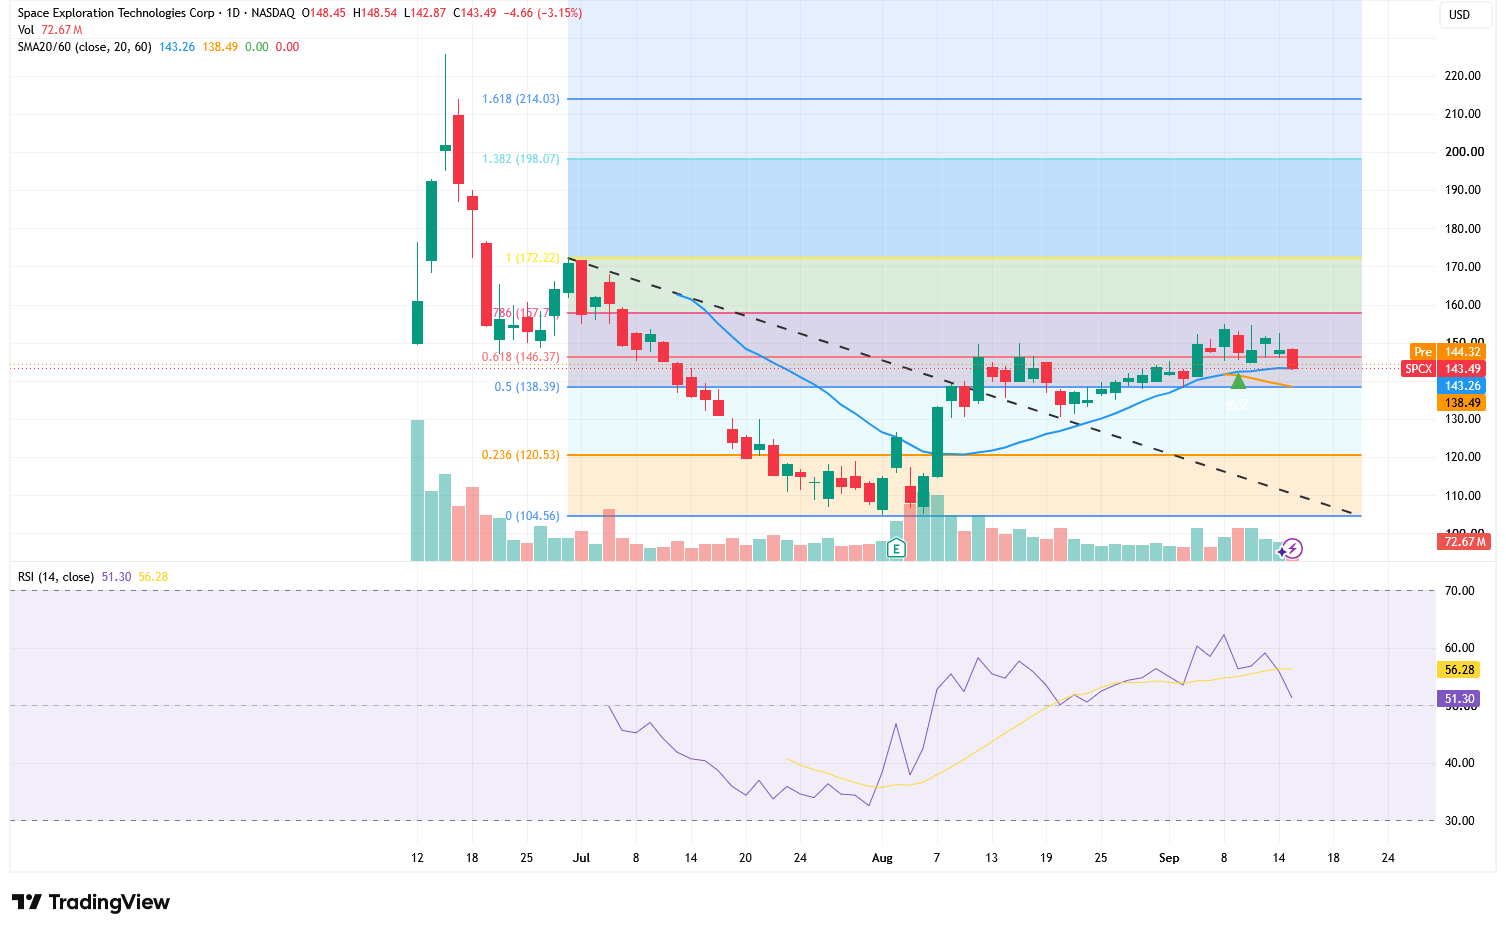
Looking at the daily chart, after rebounding from a low of $104.56, SPCX has broken above the previous downtrend line and formed higher lows, indicating that the earlier unilateral decline structure has been repaired. The 20-day moving average rose to $143.26 and crossed above the 60-day moving average of $138.49, with the short-term trend remaining bullish.
However, SPCX recently fell 3.15% to close at $143.49, pulling back intraday from $148.54 to near the day's low, reflecting noticeable selling pressure in the $146–$150 region. The current stock price is testing the 20-day moving average, and whether the short-term breakout can continue depends on whether the area around $143 can hold.
$146.37 is the first resistance level; only if the stock price re-establishes itself above this level will it have a chance to retest $150–$153. A further breakout above $157.77 on increased volume could open up upside space to $172.22. If expectations for Starship reaching orbit continue to improve market sentiment, leading to a strong breakout above $172, attention can shift to $198.07 and $214.03, though these serve as medium-term extension targets.
Regarding momentum, the 14-day RSI stands at 51.30, remaining above the 50 bullish/bearish line, but it has fallen below the signal line of 56.28, indicating that recent upside momentum has weakened. The RSI has not turned bearish yet, but a renewed breakout above 56–60 is needed to provide stronger confirmation for the stock price breaking above $158.
On the downside, attention should first be paid to the 20-day moving average at $143.26. If the daily closing price drops below $143, the stock price may further test $138.39–$138.49, an area formed jointly by the 0.5 Fibonacci level and the 60-day moving average. If $138 is also broken on heavy volume, the rebound structure will weaken significantly, and the next support levels may shift down to $130 and $120.53.
Recommended Articles


