

WTI Futures (USOIL-F) Moved Sharply on Sep 16: Inventories, the Dollar, or Geopolitics?

Source Tradingkey

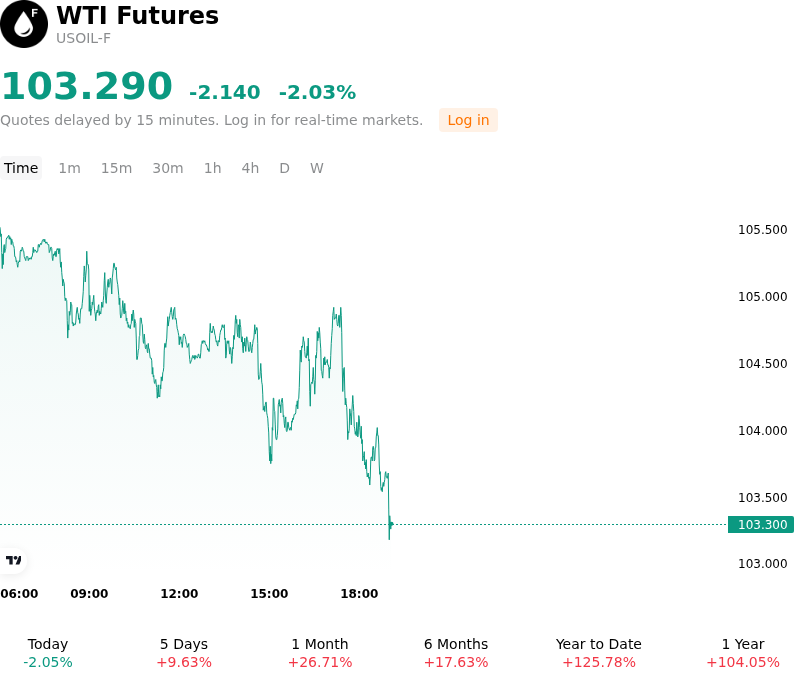
WTI Futures (USOIL-F) is down 2.03% at Sep 16 07:05(ET), now at $103.29, with a 7-day up of 6.90%.
SummaryOverview

What is driving WTI Futures (USOIL-F)’s stock price down today?

West Texas Intermediate crude oil declined primarily as an unexpected build in U.S. commercial crude inventories alleviated near-term domestic supply tightness expectations. Weekly industry inventory data revealed a substantial crude stockpile accumulation that sharply contrasted with market expectations for a draw. The broad-based inventory gain, accompanied by builds in refined product stockpiles including gasoline and distillates, signaled softer short-term refinery demand and prompted institutional market participants to lock in profits following the recent rally to multi-month highs.

The downward pressure was reinforced by macroeconomic caution ahead of the Federal Reserve's monetary policy decision. Heightened rate expectations and elevated Treasury yields provided support to the U.S. dollar, making dollar-denominated energy commodities more expensive for international buyers. Concerns that prolonged restrictive monetary policy could weigh on global economic activity and industrial energy consumption further undermined near-term demand sentiment.

Despite the intraday pullback driven by U.S. inventory dynamics and macro hedging, the downside was limited by ongoing structural supply risks in the Middle East. Disruptions to vital regional export pipelines, suspended loadings at key shipping terminals, and constrained maritime transits through critical chokepoints continue to restrict physical crude availability, particularly for sour grades. As a result, market participants view the decline as a localized, inventory- and policy-driven repricing within an otherwise tight global supply balance.

Technical Analysis of WTI Futures (USOIL-F)

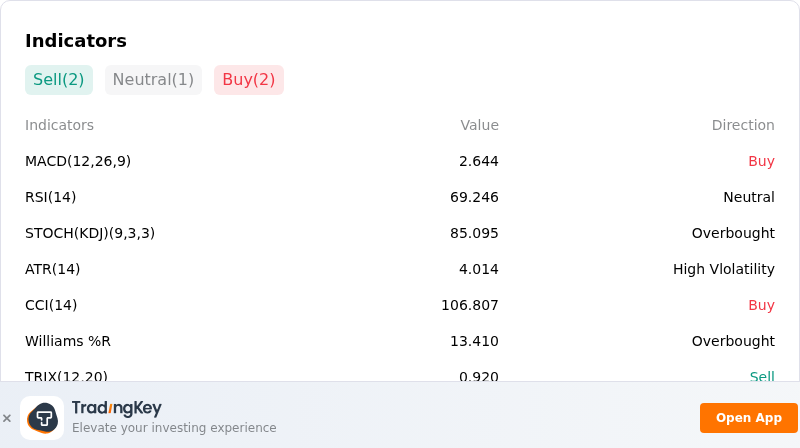
Technically, WTI Futures (USOIL-F) shows a MACD (12,26,9) value of 2.644, indicating a buy signal. The RSI at 69.246 suggests neutral condition and the Williams %R at 13.410 suggests overbought condition. Please monitor closely.
IndicatorAnalysis

More details about WTI Futures (USOIL-F)

Recent Events and Risks:

  • Unexpected U.S. Crude Stockpile Accumulation: Weekly industry inventory data reported a surprise surge of over 7.1 million barrels in domestic crude stockpiles alongside builds in refined products, defying market consensus for a drawdown and triggering immediate intraday selling pressure on WTI futures.
  • Demand Growth Forecast Downgrades: Consecutive monthly reports from both OPEC and the International Energy Agency trimmed global oil demand growth expectations for 2026, driven by persistent weakness in industrial consumption, sluggish distillate demand, and contracting refining margins in Asia.
  • Macro Risk-Off and Dollar Index Strength: Firming bond yields and a strengthening U.S. Dollar Index ahead of central bank rate decisions have raised transaction costs for foreign buyers, prompting institutional unwinding of long commodity positioning and dampening broader risk sentiment.
  • Potential Rapid Unwinding of Geopolitical Risk Premium: Market expectations that temporary Middle Eastern transit bottlenecks and pipeline disruptions will resume normal operations within days create downside volatility, leaving prices susceptible to sharp profit-taking as short-term risk premiums dissolve.
Disclaimer: For information purposes only. Past performance is not indicative of future results.
placeholder
Brent tests $108 as a key export pipeline stays shut — can the rally clear $110?Brent crude rose 2.55% to $106.97 and WTI 2.32% to $102.30 as a major regional export pipeline remained offline with no restart timeline. Front-month backwardation has widened to $5.53 from $3.84 a week ago, European gas is at its highest since December 2022, and one analyst sees $119.48 if talks stall.
Author  Irene Q.
Sep 14, Mon
Brent crude rose 2.55% to $106.97 and WTI 2.32% to $102.30 as a major regional export pipeline remained offline with no restart timeline. Front-month backwardation has widened to $5.53 from $3.84 a week ago, European gas is at its highest since December 2022, and one analyst sees $119.48 if talks stall.
placeholder
Fed hike odds near 90% into Wednesday's decision — how to trade the dollar, gold and the S&P 500A 0.3% monthly core CPI print has lifted the market-implied probability of a 25bp Fed hike on 16 September to roughly 86.5% ~ 90%, which would be the first increase since July 2023. Here is the decision timeline, the pricing versus the forecasts, both scenarios, and the key levels for the dollar, gold and the S&P 500.
Author  Suzie
Sep 14, Mon
A 0.3% monthly core CPI print has lifted the market-implied probability of a 25bp Fed hike on 16 September to roughly 86.5% ~ 90%, which would be the first increase since July 2023. Here is the decision timeline, the pricing versus the forecasts, both scenarios, and the key levels for the dollar, gold and the S&P 500.
placeholder
Gold falls below $4,300 as higher US yields bolster Fed rate hike betsGold price (XAU/USD) tumbles to near $4,295 during the early Asian session on Tuesday. The precious metal faces some selling pressure as rising bond yields and surging energy prices strengthen expectations that the US Federal Reserve (Fed) will raise interest rates this week. 
Author  FXStreet
Yesterday 01: 23
Gold price (XAU/USD) tumbles to near $4,295 during the early Asian session on Tuesday. The precious metal faces some selling pressure as rising bond yields and surging energy prices strengthen expectations that the US Federal Reserve (Fed) will raise interest rates this week. 
placeholder
【Daily Brief】10-year Treasury yield briefly tops 5%, S&P 500 slips to 7,602 and the dollar firms at 99.3 as the Fed's decision eve beginsThe 10-year Treasury yield touched 5.014% on Monday — its first print above 5% since October 2023 — while the S&P 500 closed 0.48% lower at 7,619.98 and the dollar index firmed to 99.3. Here is the full market wrap ahead of Wednesday's FOMC decision, the dot plot and the August retail sales report, plus today's CLARITY Act Senate vote.
Author  Irene Q.
Yesterday 08: 16
The 10-year Treasury yield touched 5.014% on Monday — its first print above 5% since October 2023 — while the S&P 500 closed 0.48% lower at 7,619.98 and the dollar index firmed to 99.3. Here is the full market wrap ahead of Wednesday's FOMC decision, the dot plot and the August retail sales report, plus today's CLARITY Act Senate vote.
placeholder
Silver breaks $64 as precious metals rebound — can gold hold the $4,280 line into the Fed decision?Silver has climbed back above $64 an ounce for the first time this week, leading a broad rebound across precious metals hours before the Federal Reserve delivers what is expected to be its first rate hike since 2023. Spot silver was last at $64.64, up 1.49% on the day, while gold reclaimed $4,300 and platinum and palladium both advanced. The question now is whether the bounce is a genuine turn — or a pause before the Fed's dot plot decides the next move.
Author  Suzie
3 hours ago
Silver has climbed back above $64 an ounce for the first time this week, leading a broad rebound across precious metals hours before the Federal Reserve delivers what is expected to be its first rate hike since 2023. Spot silver was last at $64.64, up 1.49% on the day, while gold reclaimed $4,300 and platinum and palladium both advanced. The question now is whether the bounce is a genuine turn — or a pause before the Fed's dot plot decides the next move.
goTop
quote