


Investors Are Getting Greedy. Warren Buffett Might Think They are "Playing With Fire."
Key Points
The Fear and Greed Index indicates that greed is driving the stock market right now.
Rising stock prices mean there's a greater chance that some stocks are overvalued.
Warren Buffett's advice for navigating the market right now is simpler than you might think.
- 10 stocks we like better than S&P 500 Index ›
After months of stagnant performance, major market indexes are soaring yet again. The S&P 500 (SNPINDEX: ^GSPC) and Dow Jones Industrial Average (DJINDICES: ^DJI) have both hit new record highs in August, and the Nasdaq Composite (NASDAQINDEX: ^IXIC) has surged by more than 8% since late July.
Investor sentiment has also shifted in recent weeks. The Fear and Greed Index measures investor sentiment on a scale of 0 to 100, based on data from seven market indicators. Lower numbers suggest that fear is predominantly driving the market, while higher figures imply greed. The index currently sits at 62, which is well within the "greed" range.
Missed Nvidia in 2009? This Rare Signal Is Flashing Again. In 2009, a "Double Down" signal flashed for a little-known chipmaker called Nvidia. For the first time in years, that same "Total Conviction" signal is flashing for a company 1/100th the size of Nvidia. Continue »
While nobody can predict the market's short-term movements, Warren Buffett has a famous warning about times like these -- and investors may want to exercise caution.
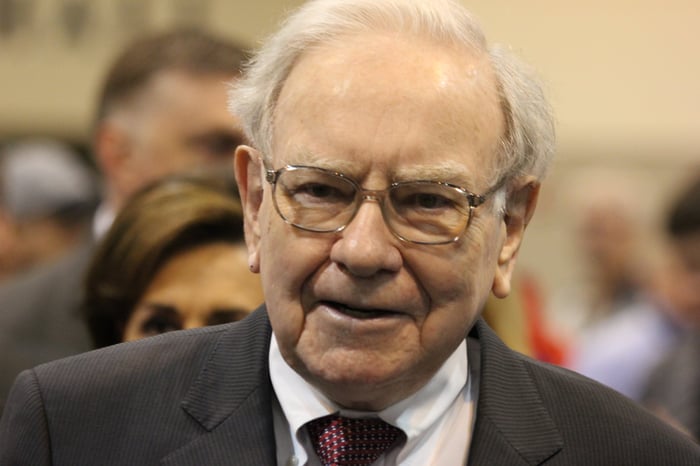
Image source: The Motley Fool.
Investors may be "playing with fire"
The downside to a bull market is that the higher prices climb, the greater the chance that the market is overvalued. With concerns about a growing AI bubble, many investors are drawing parallels to the dot-com bear market of the early 2000s.
In 1999, Buffett predicted that the market was due for a pullback, warning investors that stock prices are likely to fall in the coming years. In 2001, he followed up on his prediction in an essay for Fortune.
Buffett explained that he used the ratio between the total value of U.S. stocks and GDP to determine that the market was overvalued -- a metric that has since been nicknamed the Buffett indicator.
"If the percentage relationship falls to the 70% or 80% area, buying stocks is likely to work very well for you," Buffett said of this metric. "If the ratio approaches 200% -- as it did in 1999 and a part of 2000 -- you are playing with fire."
As of this writing, the Buffett indicator is sitting at a record high of around 232%.
History says this is the best move investors can make
Some stocks are overvalued right now, and those investments will likely have the furthest to fall if the market takes a turn. During the dot-com bubble, for instance, hundreds of high-flying tech companies failed to survive the bear market despite their promising IPOs.
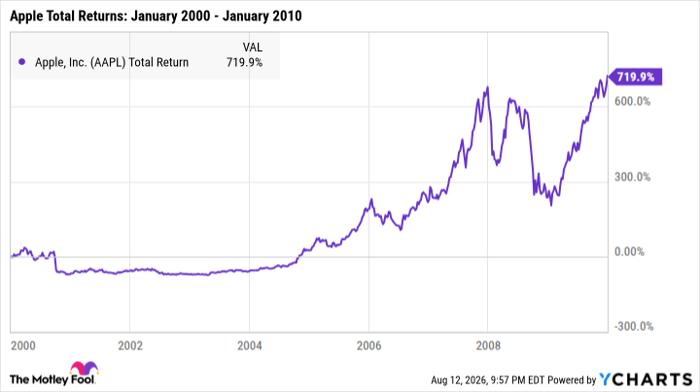
But not all tech companies failed during the dot-com bubble burst. A few went on to become some of the largest and most influential companies in the world. Apple, for example, lost more than 70% of its value throughout 2000 alone. Yet in the decade that followed, it earned total returns of more than 700%.
AAPL Total Return Level data by YCharts
In Buffett's 1999 warning to investors, he offered this advice about choosing stocks: "The key to investing is not assessing how much an industry is going to affect society, or how much it will grow, but rather determining the competitive advantage of any given company and, above all, the durability of that advantage."
Nobody can predict the market's short-term future, so it's unclear whether an AI bubble is looming. But if history proves just one thing, it's that investing in quality stocks and holding them for the long term is key to surviving even the worst bouts of volatility.
Should you buy stock in S&P 500 Index right now?
Before you buy stock in S&P 500 Index, consider this:
The Motley Fool Stock Advisor analyst team just identified what they believe are the 10 best stocks for investors to buy now… and S&P 500 Index wasn’t one of them. The 10 stocks that made the cut could produce monster returns in the coming years.
Consider when Netflix made this list on December 17, 2004... if you invested $1,000 at the time of our recommendation, you’d have $400,209!* Or when Nvidia made this list on April 15, 2005... if you invested $1,000 at the time of our recommendation, you’d have $1,375,393!*
Now, it’s worth noting Stock Advisor’s total average return is 964% — a market-crushing outperformance compared to 215% for the S&P 500. Don't miss the latest top 10 list, available with Stock Advisor, and join an investing community built by individual investors for individual investors.
See the 10 stocks »
*Stock Advisor returns as of August 14, 2026.
Katie Brockman has no position in any of the stocks mentioned. The Motley Fool has positions in and recommends Apple. The Motley Fool has a disclosure policy.
Recommended Articles


