


The Stock Market Just Made a Move That Warren Buffett Has Warned About. History Says Investors Should Make This 1 Move.
Key Points
The U.S. stock market’s total capitalization is 2.4 times bigger than the country’s GDP.
In the past decade, the S&P 500 index produced a 318% total return, despite the Buffett indicator being at an expensive level at the start of this time period.
Investors would be wise to stay the course, as it’s time in the market that matters most for long-term success.
- 10 stocks we like better than S&P 500 Index ›
It's almost impossible for investors to be critical of the stock market these days. In 2026, the S&P 500 index (SNPINDEX: ^GSPC) has so far generated a total return of 14% (as of Aug. 12). This follows a fantastic 18% total return in 2025, with double-digit gains posted in the two years before that as well. Stock investors are making money.
However, investors continue to monitor valuations. To be more specific, the Buffett indicator, a metric from the Oracle of Omaha, might be signaling what's to come.
Missed Nvidia in 2009? This Rare Signal Is Flashing Again. In 2009, a "Double Down" signal flashed for a little-known chipmaker called Nvidia. For the first time in years, that same "Total Conviction" signal is flashing for a company 1/100th the size of Nvidia. Continue »
It's not a good idea to panic, though. History says investors should make this one move.
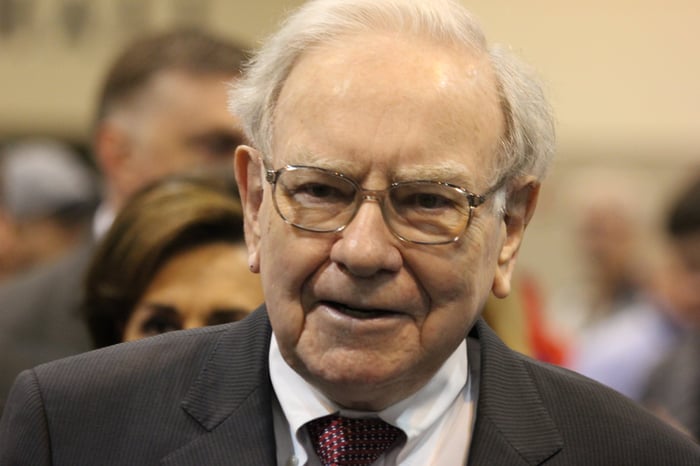
Former Berkshire Hathaway CEO Warren Buffett. Image source: Getty Images.
The Buffett indicator considers two key metrics
The Buffett indicator, first mentioned by Warren Buffett in 2001, measures the total capitalization of the U.S. stock market relative to the country's gross domestic product. This number is like the popular price-to-earnings ratio, except it applies to the entire market and economy. It's a valuation gauge.
Right now, the Buffett indicator is at 238%, an all-time high. This means the stock market's value is 2.4 times the size of the entire U.S. economy. Assuming that a reading of 100% shows that valuations are fair, the current level suggests a stock market bubble ready to pop.
There are limitations to the Buffett indicator that investors shouldn't overlook. This figure doesn't account for the fact that large U.S. companies generate significant revenue from other countries. This can inflate the ratio. If it were possible to adjust valuations downward to reflect only the financial results from domestic operations, the Buffett indicator would be a more accurate metric.
It's also important to understand the market's composition in 2026. Tech-heavy enterprises dominate, commanding market caps that were unthinkable in previous generations. Even at their scale, some of these businesses continue to grow rapidly, post huge profits, and possess durable competitive advantages. And many are sitting at the center of the artificial intelligence boom, which could be another major growth catalyst.
It's tempting, but avoid trying to time the market
Successful investing comes down to this basic principle: Buy low and sell high. Every investor wants to be able to do this consistently. But it might encourage trading too frequently in an effort to correctly time the market. This is a game that you shouldn't play, as it can lead to losses in your portfolio.
The one move investors can make, especially when the Buffett indicator sits at 238%, is to avoid trying to time the market. This suggestion might come as a surprise. After all, the natural line of thinking would be to sell stocks because of elevated valuations. That's a rational perspective.
The goal would then be to buy these companies back once there's a correction or bear market, capitalizing on lower valuations to unlock greater upside. Investors who adopt this strategy would be taking advantage of the market's shifting sentiment. It all sounds so easy.
But it's best to focus on spending time in the market rather than timing it. High valuations can make investors jittery. Think about the long-term trend, though. That's where the real money is made.
Over the past 10 years, the S&P 500 index has generated a total return of 318%. At the beginning of this period, the Buffett indicator was 121%, viewed as extremely expensive at the time. Bearish investors who sold off their entire portfolios missed out on a decade of terrific gains.
This isn't to say that the coming 10 years will see a similar performance. It's just that patience is usually rewarded in the stock market, despite persistent worries about valuation. Investors must stay the course.
Should you buy stock in S&P 500 Index right now?
Before you buy stock in S&P 500 Index, consider this:
The Motley Fool Stock Advisor analyst team just identified what they believe are the 10 best stocks for investors to buy now… and S&P 500 Index wasn’t one of them. The 10 stocks that made the cut could produce monster returns in the coming years.
Consider when Netflix made this list on December 17, 2004... if you invested $1,000 at the time of our recommendation, you’d have $400,209!* Or when Nvidia made this list on April 15, 2005... if you invested $1,000 at the time of our recommendation, you’d have $1,375,393!*
Now, it’s worth noting Stock Advisor’s total average return is 964% — a market-crushing outperformance compared to 215% for the S&P 500. Don't miss the latest top 10 list, available with Stock Advisor, and join an investing community built by individual investors for individual investors.
See the 10 stocks »
*Stock Advisor returns as of August 13, 2026.
Neil Patel has no position in any of the stocks mentioned. The Motley Fool has no position in any of the stocks mentioned. The Motley Fool has a disclosure policy.
Recommended Articles


