


The Stock Market Is Flashing the Same Warning Signal That It Did Before the Dot-Com Bubble. Here's What History Says Comes Next.
Key Points
One way to measure the S&P 500's valuation is by looking at the Shiller CAPE ratio.
The CAPE ratio measures the S&P 500's value relative to its 10-year average inflation-adjusted earnings.
The last time the CAPE ratio was this high, the market made a big move.
- 10 stocks we like better than S&P 500 Index ›
Despite multiple headwinds this year, stocks have continued their uphill march. The benchmark S&P 500 (SNPINDEX: ^GSPC) has shrugged off the conflict with Iran, persistently elevated inflation, and a variety of concerns triggered by artificial intelligence, climbing 13% on the year (as of Aug. 11).
While valuations of artificial intelligence (AI) companies did take a breather earlier this year, investors have returned to the group in recent weeks, leading to a strong rebound. The S&P 500 is now up more than 100% since the start of 2023, and many now think the index will hit 8,000 this year.
Missed Nvidia in 2009? This Rare Signal Is Flashing Again. In 2009, a "Double Down" signal flashed for a little-known chipmaker called Nvidia. For the first time in years, that same "Total Conviction" signal is flashing for a company 1/100th the size of Nvidia. Continue »
Yet, the stock market is now flashing the same warning signal it did during the dot-com bubble. Here's what history suggests comes next.

Image source: Getty Images.
The S&P 500 has rarely traded at this high a valuation
As investors might expect, market gains have led to high valuations. In fact, the market has traded at these levels only once before, in 2000, during the dot-com bubble.
One way to look at the S&P 500's valuation is by using the Shiller CAPE ratio. This ratio divides the S&P 500's value by its 10-year average inflation-adjusted earnings. This helps smooth out the various levels of earnings the S&P 500 will experience over an entire economic cycle and accounts for inflation.
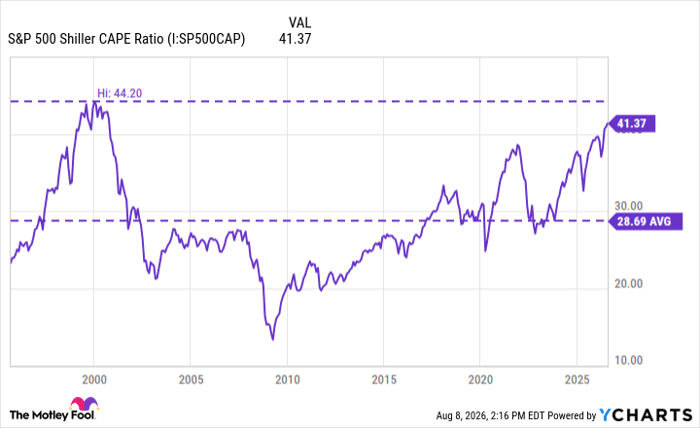
S&P 500 Shiller CAPE Ratio data by YCharts
As you can see, the only time the S&P 500 Shiller CAPE ratio was this high was in 2000, during the rise of the internet. The current CAPE ratio is nearing that level and is well above the long-term average Shiller CAPE ratio.
Most long-term investors know exactly what happened last time the CAPE reached these levels: In March 2000, the dot-com bubble burst and financial markets imploded, particularly the tech-heavy Nasdaq Composite (NASDAQINDEX: ^IXIC). According to Goldman Sachs, the market for new initial public offerings froze, and by October 2002, the Nasdaq had cratered 77% from its peak.
Interestingly, many investors see similarities between what happened in 2000 and now. In 2000, the market was dealing with the internet, a game-changing technology. Today, the market is grappling with the effects of AI.
Furthermore, companies also spent hundreds of billions on infrastructure to power the internet, such as fiber-optic cables. Today, a small cohort of large tech companies is spending hundreds of billions on chips and data centers to power AI.
History has a weird way of circling back
Investors find themselves in an interesting spot right now. On the surface, although inflation remains a concern, the U.S. economy generally looks strong, albeit unbalanced, while unemployment remains low.
Many AI stocks certainly trade at nosebleed valuations, but many of the members of the "Magnificent Seven," which are funding the bulk of the AI infrastructure build-out, don't trade at obscene valuations, at least compared to their longer-term averages.
On the other hand, there are certainly warning signs. Magnificent Seven companies have begun to deplete their free cash flow as they spend and take on debt to fund AI infrastructure. Furthermore, investors are concerned that companies like OpenAI and Anthropic are driving much of the hyperscalers' revenue growth by boosting demand for AI compute, making the health of these companies imperative to the AI trade.
If history repeats itself, AI is in for a big crash, but then it will work out incredibly well in the long term. However, while history often rhymes, it rarely repeats. Big crashes often don't come from what everyone is expecting, so I suspect the next big crash will not be so predictable.
My advice to long-term investors who want to continue investing in AI companies is to buy stocks trading at more reasonable valuations, which are more likely to navigate a market in which AI leaders stumble. This includes many stocks in the Magnificent Seven, such as Microsoft, Alphabet, Amazon, and Apple. Apple is the least exposed to AI because it hasn't invested significantly in AI infrastructure.
Should you buy stock in S&P 500 Index right now?
Before you buy stock in S&P 500 Index, consider this:
The Motley Fool Stock Advisor analyst team just identified what they believe are the 10 best stocks for investors to buy now… and S&P 500 Index wasn’t one of them. The 10 stocks that made the cut could produce monster returns in the coming years.
Consider when Netflix made this list on December 17, 2004... if you invested $1,000 at the time of our recommendation, you’d have $411,427!* Or when Nvidia made this list on April 15, 2005... if you invested $1,000 at the time of our recommendation, you’d have $1,335,252!*
Now, it’s worth noting Stock Advisor’s total average return is 965% — a market-crushing outperformance compared to 215% for the S&P 500. Don't miss the latest top 10 list, available with Stock Advisor, and join an investing community built by individual investors for individual investors.
See the 10 stocks »
*Stock Advisor returns as of August 12, 2026.
Bram Berkowitz has no position in any of the stocks mentioned. The Motley Fool has positions in and recommends Alphabet, Amazon, Apple, Goldman Sachs Group, and Microsoft. The Motley Fool has a disclosure policy.
Recommended Articles


