


Nvidia Stock Price Forecast: Can It Return to $236 All-Time High Amid AI ‘Round-Tripping’ Controversy?
TradingKey - As of the close on August 3, Eastern Time, Nvidia ( NVDA) shares closed at $206.64, up 2.93%, but remained about 13% off its all-time high of $236.54.
Nvidia's year-to-date gain is about 10.75%, while over the same period Amazon ( AMZN) rose over 20%, Google ( GOOGL) gained about 19.41%, and Apple ( AAPL) rose 11.52%. As the core play in the AI rally, Nvidia's relative performance among the 'Magnificent Seven' is no longer in the lead.
Company Name | Ticker | 2026 Year-to-Date (YTD) Change |
Nvidia | NVDA | 10.75% |
Apple | AAPL | 11.52% |
Alphabet | GOOGL/GOOG | 19.41% |
Amazon | AMZN | 23.01% |
Meta Platforms | META | -10.39% |
Microsoft | MSFT | 0.80% |
Tesla | TSLA | -28.43% |
Why Nvidia’s Stock Price Has Stopped Rising?
In mid-May, the company's shares rallied for seven consecutive trading days to hit a record high, with its market capitalization once approaching $6 trillion. At the time, the market widely expected AI infrastructure demand to remain robust.
By July, market sentiment had shifted dramatically. Although Wall Street analysts collectively raised their price targets for Nvidia, the stock fluctuated lower despite the positive news. The market's focus shifted to Nvidia's infrastructure deals with SK Group and OpenAI, totaling up to $750 billion, which sparked a heated debate on Wall Street over 'circular financing'.
Critics argue that funds flow from Nvidia to its customers and ultimately return to Nvidia's books as revenue. This closed-loop structure has sparked market concerns over the authenticity of AI demand and the transmission of credit risk.
The memory chip sector also experienced volatility. Throughout the month of July, Samsung Electronics, SK Hynix ( SKHY) and other memory makers saw their stock prices fluctuate wildly, with SK Hynix falling by about 35% over the month, Samsung Electronics dropping about 21%, and Kioxia being cut in half from its record high in June.
Jensen Huang recently stated that memory has become the biggest bottleneck for AI development. This not only demonstrates robust demand for AI computing power but also means Nvidia's shipment pace could be constrained as a result. Over the same period, upstream graphics memory costs continued to climb, and Nvidia has sent price hike notices for GPU bundles to graphics card manufacturers.
Can Nvidia Stock Keep Rising?
The stock price has recently been under pressure, but institutional target prices are generally higher than the current price:
Institution | Target Price (USD) | Bullish Thesis |
Melius Research | 400 | Demand for AI infrastructure continues to exceed expectations, with monetization capabilities leading its peers |
BofA | 350 | Total addressable market (TAM) for AI data center systems revised upward to $1.7 trillion |
Benchmark | 335 | Optimistic about a new demand cycle driven by Blackwell and Rubin architecture upgrades |
KeyBanc | 330 | Maintains "Overweight" rating, optimistic about the continued volume growth of the data center business |
Wells Fargo | 315 | Gigawatt-scale AI infrastructure deployment model projects that data center revenue will continue to surge |
Wells Fargo analyst Aaron Rakers built an estimation model with gigawatt-scale AI infrastructure capacity as the core variable, estimating that Nvidia's deployed capacity will gradually increase from 9.2 GW to 25.2 GW from fiscal year 2026 to 2029. Rakers believes that the supply-demand imbalance in computing power will be the core driver for sustained growth in data center revenue.
As of August 3, based on Wall Street's average target price of approximately $303, there remains about 46.5% upside potential compared to the current level of $206.64.
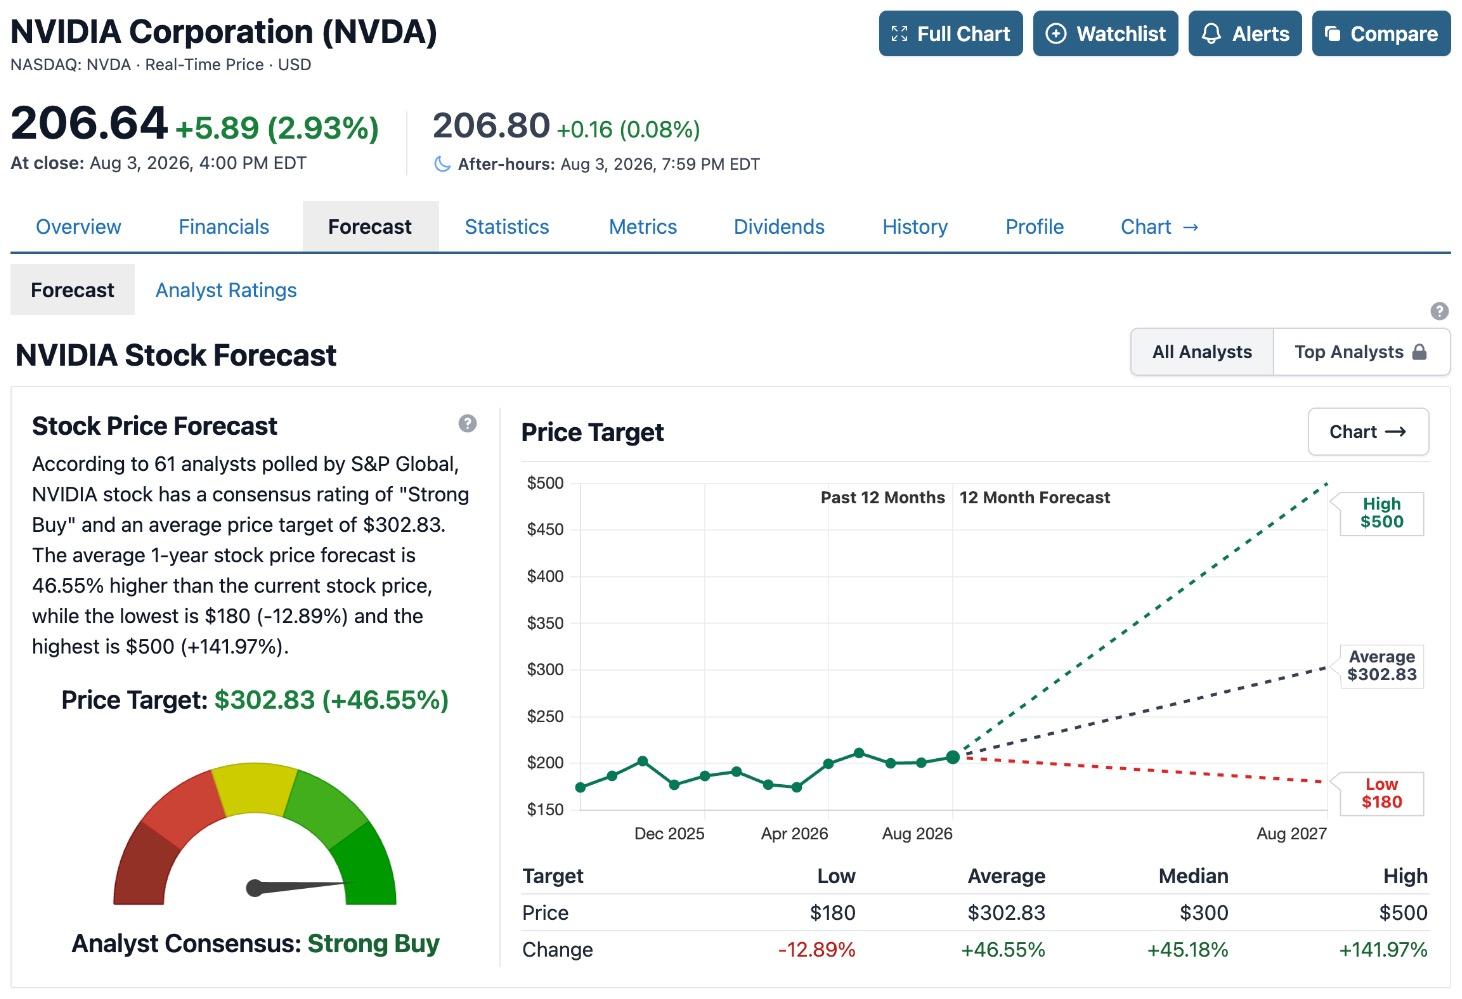
[Source: Stock Analysis Official Website]
Nvidia Stock Price Forecast: Can It Return to Record Highs in August?
For Nvidia's stock price to regain strength, it must address two key issues: first, whether the tight memory chip supply chain can ease, given that shortages of key components like HBM directly drive up product costs, and if the supply side fails to improve, hardware gross margins will continue to face pressure, thereby limiting the room for earnings recovery; second, whether market concerns over "circular financing" can gradually subside.
If both of these issues progress in a positive direction, combined with the architectural upgrade cycles of the Blackwell and Rubin platforms, the stock price is expected to break through its historical high of $236.54.
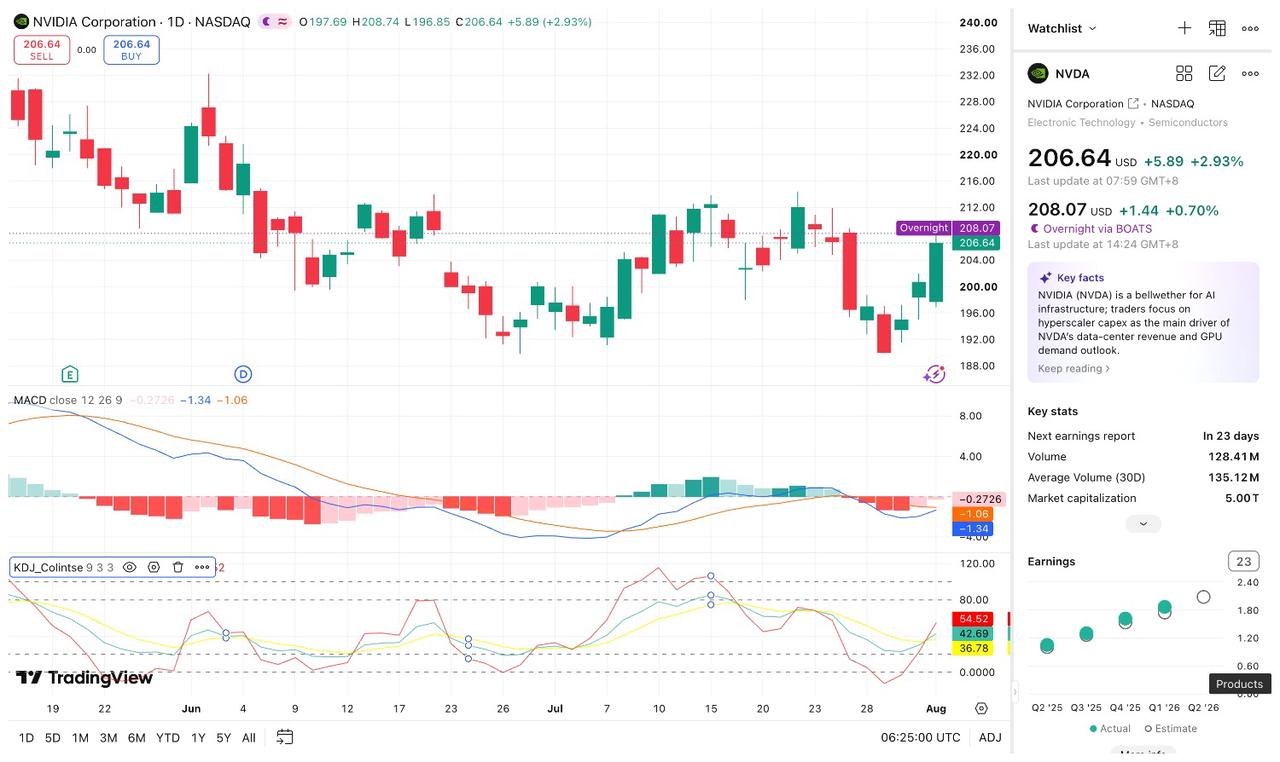
[Source: TradingView]
Technical indicators show that as of the August 3 closing price of $206.64, MACD bearish momentum continues to weaken, the KDJ has formed a golden cross in the neutral zone, and the RSI has rebounded to around 53, easing short-term downward pressure. However, the MACD remains below the zero line, and a trend reversal has yet to be confirmed.
MACD: Bearish alignment but momentum continues to weaken. On August 3, the MACD Difference (DIF) was -1.34 and the Signal Line (DEA) was -1.06, both below the zero line, while the histogram (-0.27) narrowed significantly.
From July 31 to August 3, the DIF rebounded from -1.94 to -1.34, and the histogram narrowed from -0.99 to -0.27. If this trend continues, the MACD is expected to form a bottom golden cross in the short term, providing technical support for a subsequent rebound.
KDJ and RSI: Moving out of the oversold zone, a mid-range golden cross emerges. On August 3, the K value (54.52) crossed above the D value (42.69) to form a golden cross in the neutral zone, indicating the emergence of short-term rebound momentum; the J value stood at 36.78, which is relatively low, suggesting that the current market is not in a strong trend.
RSI (14) is around 53, which is in the neutral-to-strong zone (typically 40-60 is neutral), meaning the market has moved out of oversold territory but has not yet entered a strong phase (above 60).
Key levels: Downside support should focus on the $190-$195 and $180-$185 ranges; upside resistance is near $208 (the 60-day moving average), with a breakout pointing to the $211-$212 area.
Summary
Nvidia's technological advantage in the AI chip market remains unchanged, with institutional price targets generally higher than its current share price, reaching as high as $400. However, tightness in the memory chip supply chain, credit concerns brought by "circular financing," and fluctuations in overall sector sentiment have left it looking somewhat stagnant among the Magnificent Seven. Whether it can return to its historical highs will largely depend on whether supply chain pressures and market confidence can recover in tandem.
Recommended Articles


