

Dogecoin Price Forecast: Bullish divergence hints at DOGE recovery

Source Fxstreet
  • Dogecoin steadies at $0.070 on Tuesday after correcting 3.5% in the previous week.
  • Derivatives metrics support a recovery, with long bets reaching the monthly high and positive funding rates.
  • The technical outlook shows a bullish divergence, suggesting bearish momentum may be losing strength.

Dogecoin (DOGE) steadies near $0.070 at the time of writing on Tuesday after falling 3.5% last week. While the broader trend remains bearish, improving derivatives metrics and bullish divergences in momentum indicators suggest that selling pressure may be easing, hinting at a potential recovery.

Derivatives metrics support a bullish bias

Derivatives data shows bullish sentiment among Dogecoin traders. CoinGlass’ long-to-short ratio for memecoin reads 1.25 on Tuesday, the highest level over a month. A ratio above one indicates bullish sentiment, as traders are betting the asset price will rise.
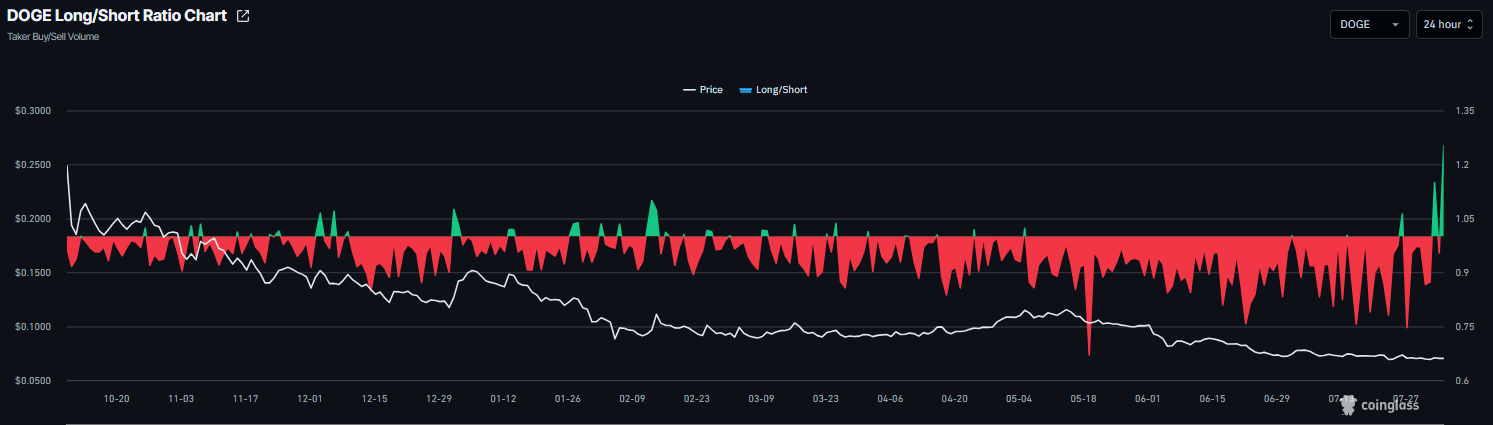
DOGE long-to-short chart. Source: Coinglass

In addition, CoinGlass’ funding rates metric for Dogecoin flipped positive on July 24, reading 0.0074% on Tuesday. These positive rates indicate that long traders are paying shorts and reflect a bullish bias for the dog-themed meme coin.
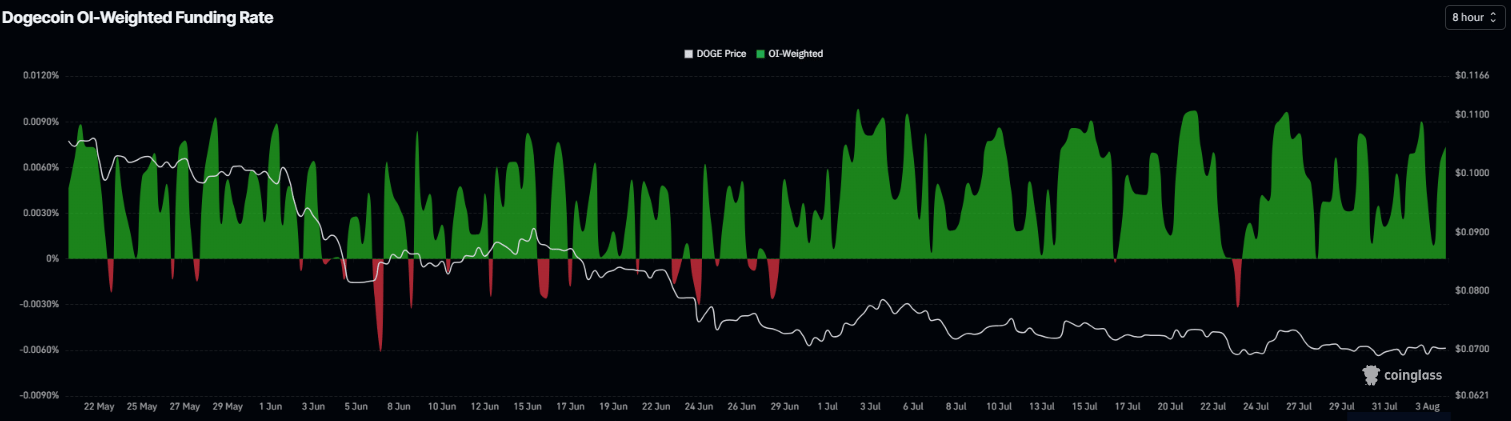
Dogecoin funding rates chart. Source: Coinglass

Dogecoin technical outlook: Bullish divergence in momentum indicators 

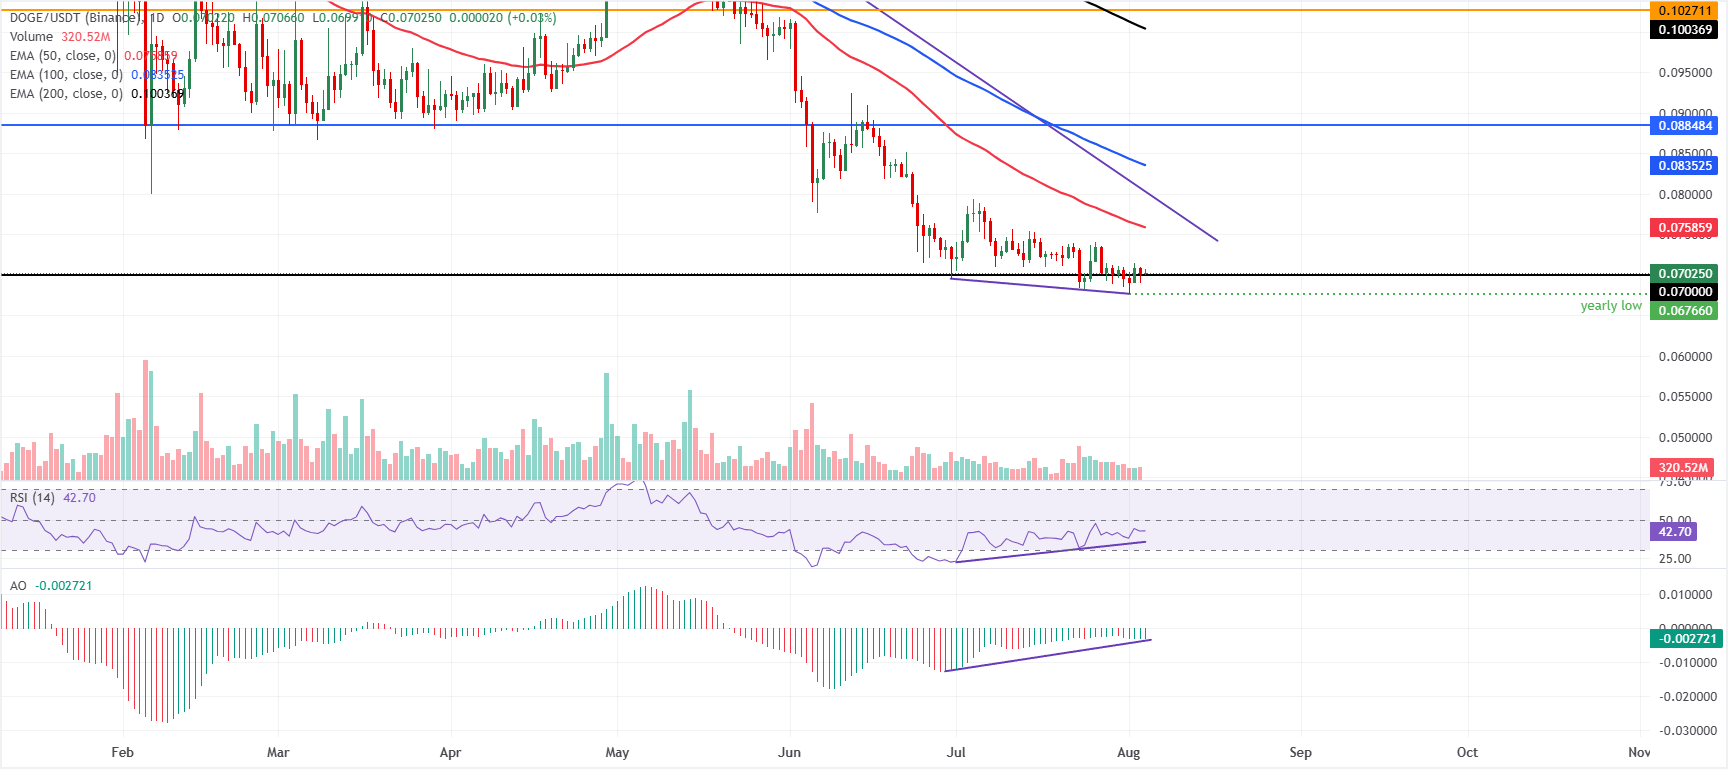
Dogecoin trades at $0.070 on Tuesday, maintaining a bearish near-term bias as price holds below the 50-day, 100-day, and 200-day Exponential Moving Averages (EMAs) at $0.075, $0.083, and $0.100, respectively. 

Momentum indicators show a bullish divergence in the Relative Strength Index (RSI) on the daily chart, as DOGE price formed a lower low on August 1 while the RSI registered a higher low, suggesting that bearish momentum is weakening. The Awesome Oscillator (AO) supports this divergence as its recent lows are rising while price remains near its lows, indicating that downside momentum is fading.

On the downside, immediate support is seen at the horizontal level of $0.070, with next support at the yearly low at $0.067; a close below it suggests deeper losses toward the key psychological level of $0.065. 

On the topside, initial resistance is defined by the 50-day EMA at $0.075, followed by the descending trendline break region near $0.080 and the 100-day EMA at $0.083; a stronger barrier is found at the $0.088 horizontal resistance, ahead of the 200-day EMA at $0.100 and the key horizontal cap at $0.102, levels that would need to be reclaimed to ease the prevailing bearish tone.
(The technical analysis of this story was written with the help of an AI tool. Know more.)

Disclaimer: For information purposes only. Past performance is not indicative of future results.
placeholder
Pi Network Price Annual Forecast: PI Heads Into a Volatile 2026 as Utility Questions Collide With Big UnlocksPi Network heads into 2026 after a 90%+ 2025 drawdown from $3.00, with 17.5 million KYC users and a smart-contract-focused Stellar v23 upgrade offering upside potential, but 1.21 billion tokens unlocking and heavy exchange deposits (437 million PI) keeping supply pressure and trust risks firmly in focus.
Author  Mitrade
Dec 19, 2025
Pi Network heads into 2026 after a 90%+ 2025 drawdown from $3.00, with 17.5 million KYC users and a smart-contract-focused Stellar v23 upgrade offering upside potential, but 1.21 billion tokens unlocking and heavy exchange deposits (437 million PI) keeping supply pressure and trust risks firmly in focus.
placeholder
Markets in 2026: Will gold, Bitcoin, and the U.S. dollar make history again? — These are how leading institutions thinkAfter a turbulent 2025, what lies ahead for commodities, forex, and cryptocurrency markets in 2026?
Author  Insights
Dec 25, 2025
After a turbulent 2025, what lies ahead for commodities, forex, and cryptocurrency markets in 2026?
placeholder
Finding The Best Japan Stocks to Buy? These are Top Japanese Companies to Watch Discover the best Japanese stocks to buy, including AI semiconductor leaders, Buffett-backed trading houses, and undervalued Japan stocks benefiting from corporate reforms and yen trends.
Author  Mitrade
May 29, Fri
Discover the best Japanese stocks to buy, including AI semiconductor leaders, Buffett-backed trading houses, and undervalued Japan stocks benefiting from corporate reforms and yen trends.
placeholder
WTI holds losses around $82.50 on renewed US-Iran diplomatic hopesWest Texas Intermediate (WTI) oil price remains in the negative territory for the second successive day, trading around $82.60 per barrel during the Asian hours on Friday. Crude oil prices have lost ground following renewed hopes for a diplomatic solution to the US-Iran conflict.
Author  FXStreet
Jul 31, Fri
West Texas Intermediate (WTI) oil price remains in the negative territory for the second successive day, trading around $82.60 per barrel during the Asian hours on Friday. Crude oil prices have lost ground following renewed hopes for a diplomatic solution to the US-Iran conflict.
placeholder
WTI trades with positive bias below mid-$79.00s on Iran uncertainty, supply concernsWest Texas Intermediate (WTI) – the benchmark US Crude Oil price – edges higher during the Asian session on Tuesday and looks to build on the overnight bounce following an intraday slump to levels below mid-$77.00s.
Author  FXStreet
6 hours ago
West Texas Intermediate (WTI) – the benchmark US Crude Oil price – edges higher during the Asian session on Tuesday and looks to build on the overnight bounce following an intraday slump to levels below mid-$77.00s.
Related Instrument
goTop
quote