


Microsoft (MSFT) Week in Review: Down 18% YTD, July 29 Earnings, Azure 40% Growth
TradingKey - Microsoft (NASDAQ: MSFT) wrapped up the week at $381.58. On the daily chart, that puts the stock below its EMA20, EMA50 and EMA200, a textbook bearish moving average stack. Year-to-date, the stock has tumbled around 18%, and it's down 24.6% over the last 12 months. In short, it's been the weakest of the Magnificent Seven while the S&P 500 has put on 9% in the same timeframe. This isn't about a weak business; Microsoft is growing at a solid clip. It's $190 billion in capex guidance for 2026 that's having investors wonder about the company's free cash flow.
The answer to that will come July 29, when Microsoft delivers its earnings for Q4 FY2026 after the closing bell. Wall Street's expecting $87.7 billion in revenue, and $4.24 in EPS. Azure grew 40% last quarter.
Why MSFT Is Down 18% When Azure Is Growing 40%
The conflict between Microsoft's business metrics and its stock price is a big theme as we head toward the big day. Azure last quarter grew 40%, better than AWS at 28% and Google's 82% (helped by a base effect). The company's Microsoft 365 commercial subscriptions are a great source of consistent recurring revenue. And Copilot is gaining ground as more companies adopt it. Microsoft's operating business is growing far faster than the market expects from a company of its stature.
The real problem is the investment required to keep that growth going. The company expects to spend roughly $190 billion on capital investments in 2026 for AI data centers, GPU clusters and network infrastructure.
That investment level, which is higher than the annual revenue of nearly all of the Fortune 500, is eating into the company's free cash flow, and depreciation is rising as hardware from the prior quarters begins to be fully amortized. This is what also sent Alphabet down 7% on its earnings (it posted $44.9 billion in quarterly capex on earnings per share of approximately $2.90).
This is a big reason Microsoft has traded at a relatively low multiple throughout the year. It's now at 21 to 22x forward earnings, the lowest since 2023. There are 97 analysts tracking the stock; its average price target sits around $589 to $592, which translates into roughly 55% upside.
This Week's Developments Beyond the Chart
There are a couple of headlines this week that give us more color on the Microsoft investment thesis, but they don't change the overall setup. Microsoft has announced an expansion of its partnership with Databricks, a data intelligence service for enterprise AI developers, which solidifies the Azure platform's role as the hosting home for all the AI applications being created on Databricks by its customers. Analysts at Truist, which reiterated its bullish view on MSFT July 24, believes the coming earnings report will blow past expectations.
Also, it's worth noting that Oracle's recent Pentagon deal signals rising spending by the US government on AI. Since Microsoft holds a long-running cloud contract with the US government it stands to be one of the chief beneficiaries of this shift.
The more ominous news is that several securities law firms, including Rosen Law and Bronstein, Gewirtz and Grossman, have filed class action investor lawsuits against the company in the July 17 to July 22 window, telling investors they should consider hiring counsel before it's too late.
The filings allege harm to investors, although specific details of these allegations aren't available in the public domain at this time. These actions carry the possibility of becoming news headlines similar to what IBM and NovoCure have recently faced.
What July 29 Must Show
Consensus for the fourth quarter of financial year 2026 is $87.7 billion in revenue, and $4.24 in EPS. For comparison, the third quarter of fiscal year 2026 had $81.3 billion in revenue, which grew 17% year over year, and earnings per share excluding one-time items of $4.14, with Azure growth of 40% quarter over quarter. A fourth quarter at consensus numbers would represent sequential growth in revenue of $6.4 billion, a consistent level of growth the company has delivered so far this calendar year. That's not a problem.
In the past four quarters, MSFT has topped earnings expectations every time. What matters is what management tells investors about the outlook for financial year 2027, and how capital spend is progressing.
If CFO Amy Hood indicates that capital investment spending for 2027 will run below $190 billion annually, or she demonstrates that Azure growth in capacity can outpace this increase, the free cash flow concern evaporates. The stock price would re-rate towards the $589 to $592 average target that Wall Street is currently pricing in.
A story from the Motley Fool, published earlier this week, predicts MSFT will rocket parabolically higher in the immediate post-July 29 period. That forecast is predicated on the 21x forward price-to-earnings multiple MSFT currently trades at being in tension with the growth rates for Azure and Copilot. A better-than-expected report accompanied by a more benign narrative on capex will go a long way toward restoring investor confidence in Microsoft's long term profitability trajectory.
MSFT Technical Setup
MSFT sits at $381.58 on the daily, well below its three big EMAs, EMA20, EMA50, and EMA200, and its RSI is a noncommittal 44.67. We’re still forming a potential double bottom off the June lows in the $349.50 to $356.40 zone, which should be the big long-term support level.
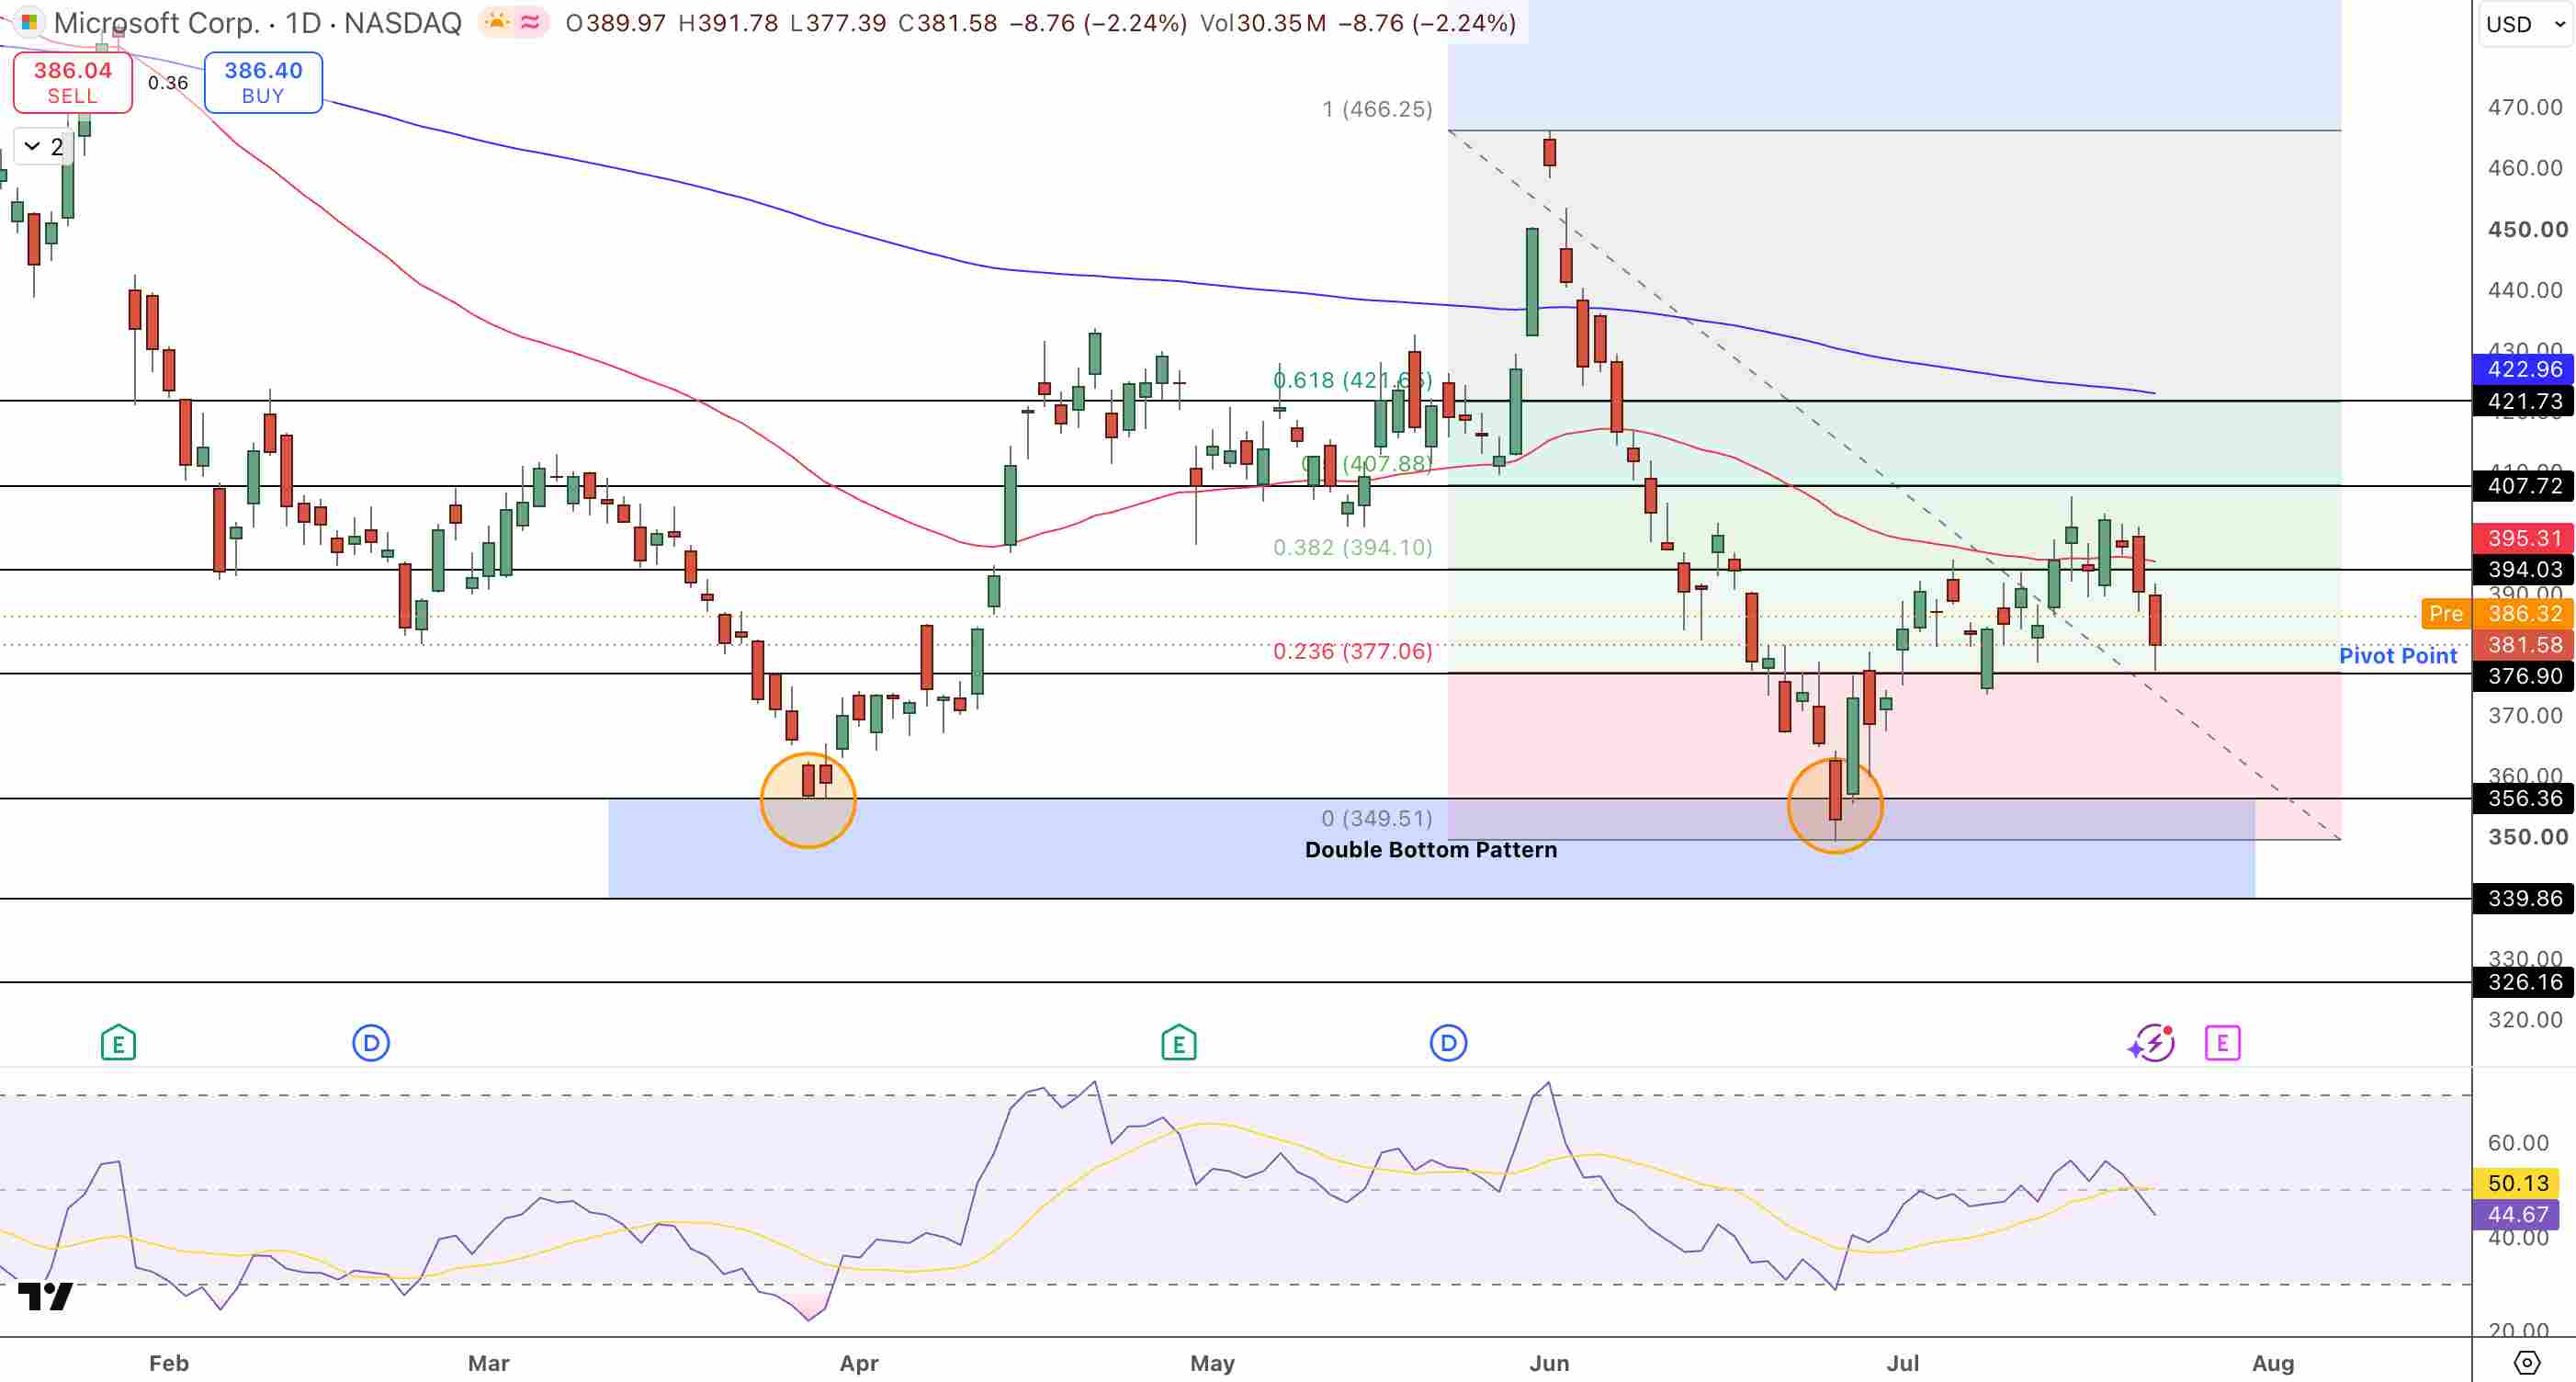
Microsoft (MSFT) Price Chart - Source: Tradingview
On the upside, the first hurdle for the bulls is $394.03, then $407.72, then $421.73. Anything above $421.73 and the 200 EMA is fair game.
Below $376.90, $356.36 and then the double-bottom base are the next levels to watch. July 29 is when we’ll know which way the double bottom gets resolved, once the earnings call closes.
Key Levels for the Week of July 28
- Current price: $381.58. Down 18% YTD, 24.6% over one year. Cheapest forward P/E since 2023
- Earnings: July 29, after the close. $87.7B consensus revenue. $4.24 EPS
- Azure: Grew 40% last quarter (AWS grew 28%)
- $190B capex guidance, 2026
- Analyst Targets: $589 to $592 (consensus across 97 analysts. Almost all Strong Buy or Buy). Roughly 55% upside from $381
- Resistance: $394.03, $407.72, $421.73 (200 EM)
- Support: $376.90, $356.36, $349.50 (the floor)
What Is Microsoft's $190 Billion Capex and Why Does It Matter?
Microsoft expects to spend around $190 billion on AI infrastructure in 2026. The outlay is aimed at data centres, Nvidia GPUs and networking. Management has said that AI demand at Azure remains stronger than supply, which underpins the large investment.
But the spending is hitting cash flows and adding depreciation ahead of when new AI infrastructure starts to meaningfully contribute to the top and bottom lines. The timing is a factor behind a weaker free cash flow and contributed to Microsoft's weaker share performance despite strong underlying business growth.
What Are the Securities Class Action Lawsuits Against Microsoft?
Between July 17 and July 22, multiple law firms filed securities class action suits against Microsoft. They are urging investors to participate. At present it is unknown on what grounds these cases have been brought. This is routine and follows significant sell-offs in share prices as the company has usually made statements that can arguably be interpreted as misleading.
For now, the cases should be followed, as more court filings and disclosures made by Microsoft will give clarity as to whether or not the cases have a material impact on Microsoft's financial position or prospects.
Bottom Line
The July 29 earnings call is the binary event this week for MSFT at $381. MSFT is down 18% YTD and at its cheapest forward multiple since 2023, even with 97 analysts targeting an average of $589 per share.
Azure has grown by 40% in the last quarter, while Copilot adoption is picking up. The bear case is centered on a $190B capex call. MSFT’s technical floor, at least on the short term, should be the double bottom in the $349 to $356 area.
A solid Q4 earnings call, plus a narrative that alleviates concerns about the impact on free cash flow, could kick off a rapid recovery. For example, Motley Fool specifically predicted the stock would go parabolic after July 29. If we dip below $376.90, the double bottom at $356 is what will be in play. Any break above $394 will start to crack our EMA stack. July 29 is the only MSFT event of the week.
Recommended Articles


