

IXUS vs. IEFA: Which International ETF Is Better for Most Investors?
Key Points
The iShares Core MSCI Total International Stock ETF has outperformed the S&P 500 index in the past year (as of June 7).
The iShares Core MSCI EAFE ETF has delivered a trailing 12-month dividend yield of 3.30%.
Since it owns more stocks from a wider range of markets, the iShares Core MSCI Total International Stock ETF could be a better choice for long-term investors.
- 10 stocks we like better than iShares Trust - iShares Core Msci Total International Stock ETF ›
Buying international exchange-traded funds (ETFs) is an easy way to tap into the growth potential of stock markets beyond America. There's no guarantee that other countries' stock markets will outperform the S&P 500 index. But owning shares in international companies can be a way to protect against a downturn in U.S. tech stocks or hedge against the risk of a weaker U.S. dollar.
Two iShares ETFs offer slightly different approaches to buying global stocks, and one is more diversified than the other. The iShares Core MSCI Total International Stock ETF (NASDAQ: IXUS) offers exposure to more than 4,000 global stocks from a wide range of markets, while the iShares Core MSCI EAFE ETF (NYSEMKT: IEFA) holds about 2,600 stocks with a focus on developed markets.
Will AI create the world's first trillionaire? Our team just released a report on the one little-known company, called an "Indispensable Monopoly" providing the critical technology Nvidia and Intel both need. Continue »
In the past year, the more-diversified fund (IXUS) has slightly outperformed the S&P 500, with a total return of 25.8%:
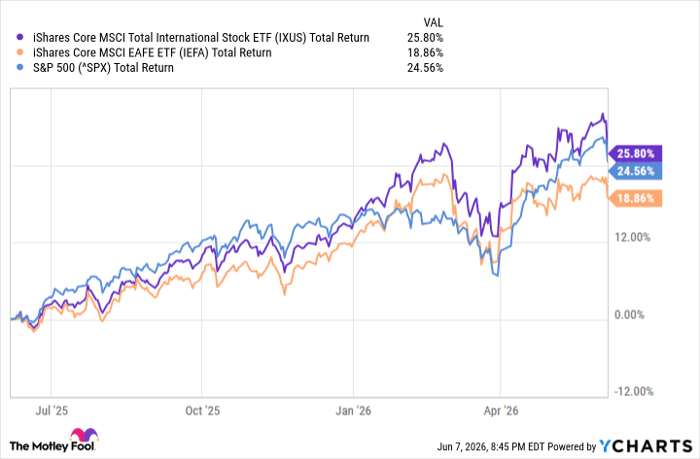
IXUS Total Return Level data by YCharts
Understanding each international ETF's past performance and current holdings can help you decide which fund might be a better fit for your goals. Let's take a closer look.

Image source: Getty Images.
IXUS vs. IEFA: Head-to-head comparison
These two iShares international ETFs have some similarities. Both funds have low fees (expense ratios of 0.07%), and both are well diversified, with thousands of international stocks.
Here's a quick high-level comparison of these two ETFs:
|
Metric |
iShares Core MSCI Total International Stock ETF (IXUS) |
iShares Core MSCI EAFE ETF (IEFA) |
|---|---|---|
|
Number of stocks |
4,344 |
2,625 |
|
Top 5 countries |
1. Japan : 14.99% of fund 2. Taiwan: 9.01% 3. United Kingdom: 8.29% 4. Canada: 8.09% 5. South Korea: 7.15% |
1. Japan: 25.49% of fund 2. United Kingdom: 14.08% 3. France: 9.01% 4. Switzerland: 8.51% 5. Germany: 8.17% |
|
Year-to-date return (by net asset value) |
14.6% |
9.5% |
|
10-year average annual total returns |
9.9% |
9.4% |
|
Dividend yield (TTM) |
2.9% |
3.3% |
|
Expense ratio |
0.07% |
0.07% |
|
Price-to-earnings (P/E) ratio |
18.97 |
18.27 |
Data source: iShares.
In general, buying a diversified portfolio of stocks is better than putting too many eggs in one basket. That holds true when comparing these two international ETFs. The iShares Core MSCI Total International Stock ETF holds more stocks than the other fund, and it has outperformed year to date and in the past 10 years.
Both of these international ETFs offer strong dividend yields, but the iShares Core MSCI EAFE ETF has delivered a higher yield (3.3%). Both ETFs are priced more cheaply than the S&P 500 according to their price-to-earnings (P/E) ratios -- the S&P 500 has a P/E ratio of 31.83. Based on that valuation metric, international stocks might have more room to run.
What stocks are in IXUS and IEFA?
The different performance and dividend yields of these two international ETFs can be explained by what types of stocks and sectors are held by each fund. Each of these iShares funds invests in a slightly different mix of stocks, countries, and industries.
Here's a quick breakdown of the top five sector holdings of these two iShares ETFs:
|
iShares Core MSCI Total International Stock ETF (IXUS) |
iShares Core MSCI EAFE ETF (IEFA) |
|---|---|
|
Financials: 21.8% |
Financials: 22.6% |
|
Information technology: 20.9% |
Industrials: 19.7% |
|
Industrials: 15.0% |
Information technology: 11.3% |
|
Consumer discretionary: 8.2% |
Healthcare: 9.4% |
|
Materials: 7.5% |
Consumer discretionary: 8.7% |
Data source: iShares.
Here's the biggest high-level difference between these two funds: the iShares Core MSCI Total International Stock ETF is more tech-heavy. About 21% its assets are invested in tech stocks, compared with only 11.3% for the other fund.
For example, if you look at the top five stock holdings, you see the iShares Core MSCI Total International Stock ETF is all tech stocks:
|
iShares Core MSCI Total International Stock ETF (IXUS) |
iShares Core MSCI EAFE ETF (IEFA) |
|---|---|
|
Taiwan Semiconductor Manufacturing: 4.35% of the fund |
ASML Holding: 2.62% |
|
Samsung Electronics: 2.35% |
HSBC Holdings: 1.25% |
|
SK Hynix: 1.75% |
Roche Holding: 1.15% |
|
ASML Holding: 1.55% |
AstraZeneca: 1.13% |
|
Tencent Holdings: 0.84% |
Novartis: 1.09% |
Data source: iShares.
The top four holdings in the iShares Core MSCI Total International Stock ETF are all semiconductor stocks. They have performed well during the artificial intelligence (AI) boom, but what if the AI boom turns into a bust? The iShares Core MSCI EAFE ETF top five holdings include one semiconductor stock (ASML Holding), but the other top holdings are financial (HSBC, a major international bank) and pharmaceutical giants.
Both funds are well-diversified, but one fund has a little more exposure to AI stocks. If you want to diversify your portfolio away from the U.S. tech boom (in case of a future tech downturn), the iShares Core MSCI EAFE ETF could be a better choice.
Why buy IXUS instead of IEFA?
Both of these iShares funds can be good choices for investors who are internationally minded and want to diversify beyond the U.S. market. They're both low-cost index funds. The iShares Core MSCI EAFE ETF ranks among the best international ETFs.
But I believe that diversification is valuable in the long run. If you look at the past 10 years of performance, the more diversified fund, the iShares Core MSCI Total International Stock ETF, has slightly outperformed:
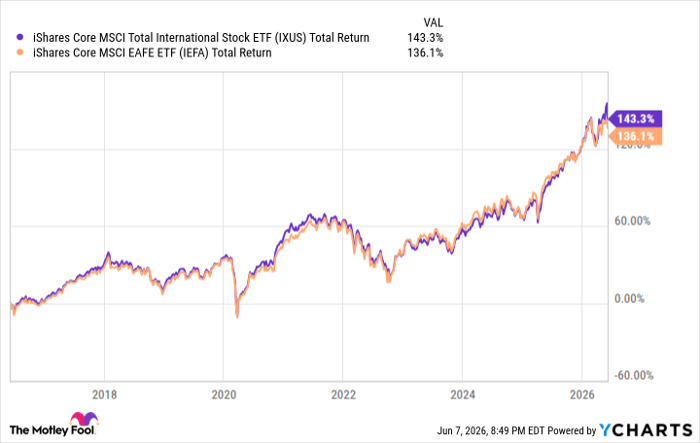
IXUS Total Return Level data by YCharts
This fund owns more than 4,300 stocks across a wide range of countries, including emerging markets such as South Korea and Taiwan. That might make it more volatile in the short run. But as a long-term investor, I'd rather have exposure to the growth potential of the world's up-and-coming economies.
Should you buy stock in iShares Trust - iShares Core Msci Total International Stock ETF right now?
Before you buy stock in iShares Trust - iShares Core Msci Total International Stock ETF, consider this:
The Motley Fool Stock Advisor analyst team just identified what they believe are the 10 best stocks for investors to buy now… and iShares Trust - iShares Core Msci Total International Stock ETF wasn’t one of them. The 10 stocks that made the cut could produce monster returns in the coming years.
Consider when Netflix made this list on December 17, 2004... if you invested $1,000 at the time of our recommendation, you’d have $445,672!* Or when Nvidia made this list on April 15, 2005... if you invested $1,000 at the time of our recommendation, you’d have $1,280,566!*
Now, it’s worth noting Stock Advisor’s total average return is 948% — a market-crushing outperformance compared to 206% for the S&P 500. Don't miss the latest top 10 list, available with Stock Advisor, and join an investing community built by individual investors for individual investors.
See the 10 stocks »
*Stock Advisor returns as of June 10, 2026.
HSBC Holdings is an advertising partner of Motley Fool Money. Ben Gran has no position in any of the stocks mentioned. The Motley Fool has positions in and recommends ASML, AstraZeneca Plc, Taiwan Semiconductor Manufacturing, and Tencent. The Motley Fool recommends HSBC Holdings and Roche Holding AG. The Motley Fool has a disclosure policy.
Recommended Articles


