

Silver Price Forecast: XAG/USD slips below 50-day SMA on strong US Dollar

- Gold Price Forecast: Oil Price Breaking $100 Fuels Inflation Concerns, Will Gold Prices Fall Further?
- Gold Price Trend Forecast: Expectations of Easing US-Iran Tensions Boost Gold Prices, $4,070 Becomes Key Level for Bulls and Bears
- Gold rallies to over two-week high, eyes $4,150 as traders track US-Iran diplomacy efforts
- Euro declines to near 1.1400 as US launches fresh strikes on Iran
- Tesla Q2 Earnings Preview: Record Deliveries Fail to Hide Profit Pressure, Can Musk Rely on AI and Autonomous Driving to Unlock New Growth Space?
- WTI climbs above $87.00 as Middle East conflict threatens key choke points

Silver pulls back from $78.20 as broad Dollar strength pressures prices in thin trade.
Bearish engulfing keeps XAG/USD trapped within $75.00–$80.00 consolidation band.
Break below $75.00 may target $70.00 and $64.10; reclaiming $80.00 restores bullish bias.
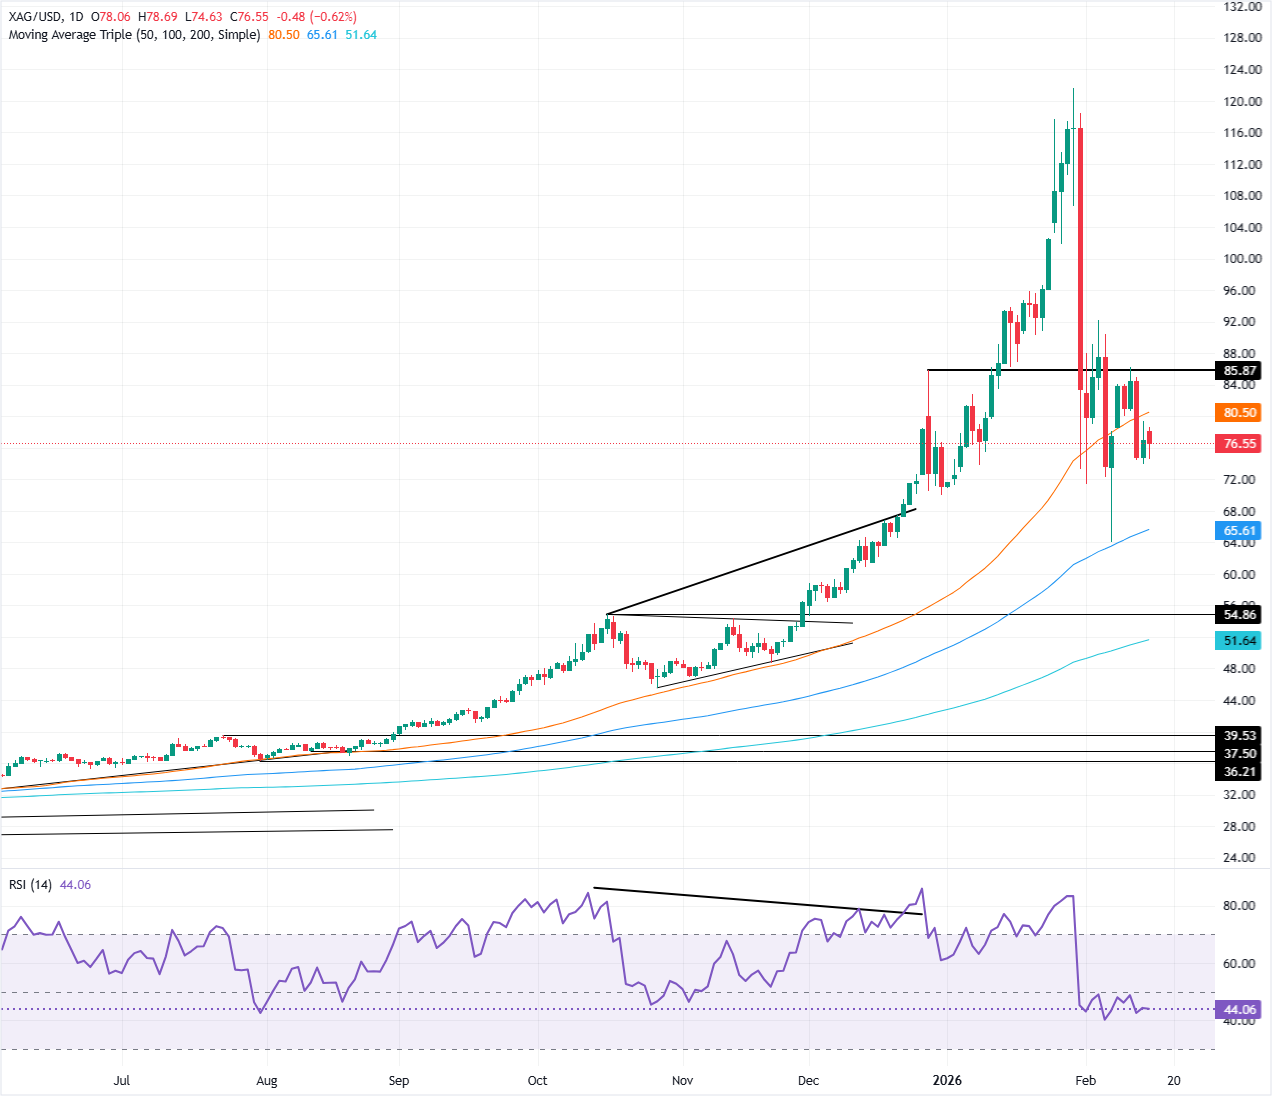
Silver price retreats during the North American session nearly 1%, after reaching a daily high of $78.20. Overall US Dollar strength amid thin volume trading as US financial markets remained closed, keeping the white metal within familiar levels, yet down below the 50-day Simple Moving Average (SMA) at $79.45.
XAG/USD Price Forecast: Technical outlook
Following the formation of a ‘bearish engulfing’ candle pattern that drove Siver prices from around $83.70 towards the $75.00 area, XAG/USD continued to exchange hands within the $75.00-$80.00 range during the last two trading sessions.
Momentum as measured by the Relative Strength Index (RSI) shows that sellers are in control, as the index sits below its neutral level.
However, sellers had failed to clear decisively the $75.00 milestone. If done, it could exacerbate a retracement towards the $70.00 figure, followed by the February 6 swing low of $64.10.
Conversely, for a bullish resumption, buyers are struggling to surpass $80.00. A breach of the latter will expose the February 12 high at $84.94, followed by the February 11 peak of $86.30 ahead of the 20-day Simple Moving Average (SMA) at $89.99.
XAG/USD Price Chart — Daily
Read more
* The content presented above, whether from a third party or not, is considered as general advice only. This article should not be construed as containing investment advice, investment recommendations, an offer of or solicitation for any transactions in financial instruments.


