

US Treasuries Continue to Rise. Could a US Debt Sell-Off Erupt in 2026?
TradingKey - On May 15, Eastern Time, the 2-year U.S. Treasury yield broke through the 4% threshold, the 10-year yield rose to 4.53%, and the 30-year yield stood firmly above 5%, marking its highest level since May 2025.
Over the past month, the 10-year yield has steadily climbed by more than 50 basis points from below 4.0%, and the 30-year yield continues to trend higher after breaking 5% with no signs of a pullback. The dual shocks of geopolitics and inflation, coupled with the leadership transition at the Federal Reserve, are pushing U.S. Treasuries into a systemic sell-off.
Dual Shocks of Geopolitics and Inflation
In April, CPI rose 3.8% year-on-year, hitting a new high since May 2023, and increased 0.6% month-on-month, both exceeding market expectations; PPI surged 6.0% year-on-year, its largest gain since 2022, with energy prices serving as the primary driver of inflation. WTI crude oil prices have consistently remained above $100, while the blockade of the Strait of Hormuz has nearly paralyzed global oil shipping, and the U.S. national average gasoline price has surpassed $4.50 per gallon.
The duration and severity of the supply shock represent the greatest uncertainty facing the inflation outlook.
John Briggs, head of North American rates strategy at Natixis, stated bluntly: "Resolve the war, and we can calculate when the pressure will ease. But if not, this oil-induced inflation stickiness extends every day, reducing the likelihood of rate cuts and increasing the risk of oil-driven inflation spreading to all other sectors."
When inflation is no longer a "one-off pulse" but becomes "sticky," the safe-haven attributes of U.S. Treasuries undergo systemic erosion. Investors are beginning to realize that holding dollar-denominated fixed-income assets no longer hedges against risk. This fundamental shift in logic is shaking the pricing foundation of U.S. Treasuries, which has served as the world's safest asset for decades.
Warsh Has Yet to Take Office, But the Bond Market Has Already "Hiked Rates" for Him
Another unique aspect of this round of Treasury sell-offs is that it coincides with a sensitive window for the leadership transition at the Federal Reserve.
Kevin Warsh has been appointed and will officially take over as Fed Chair in June. Markets had initially bet that Warsh would push for a policy mix of rate cuts and quantitative tightening to drive steepener trades. However, with oil prices remaining high and inflation persisting, interest rate pricing has undergone a fundamental reversal.
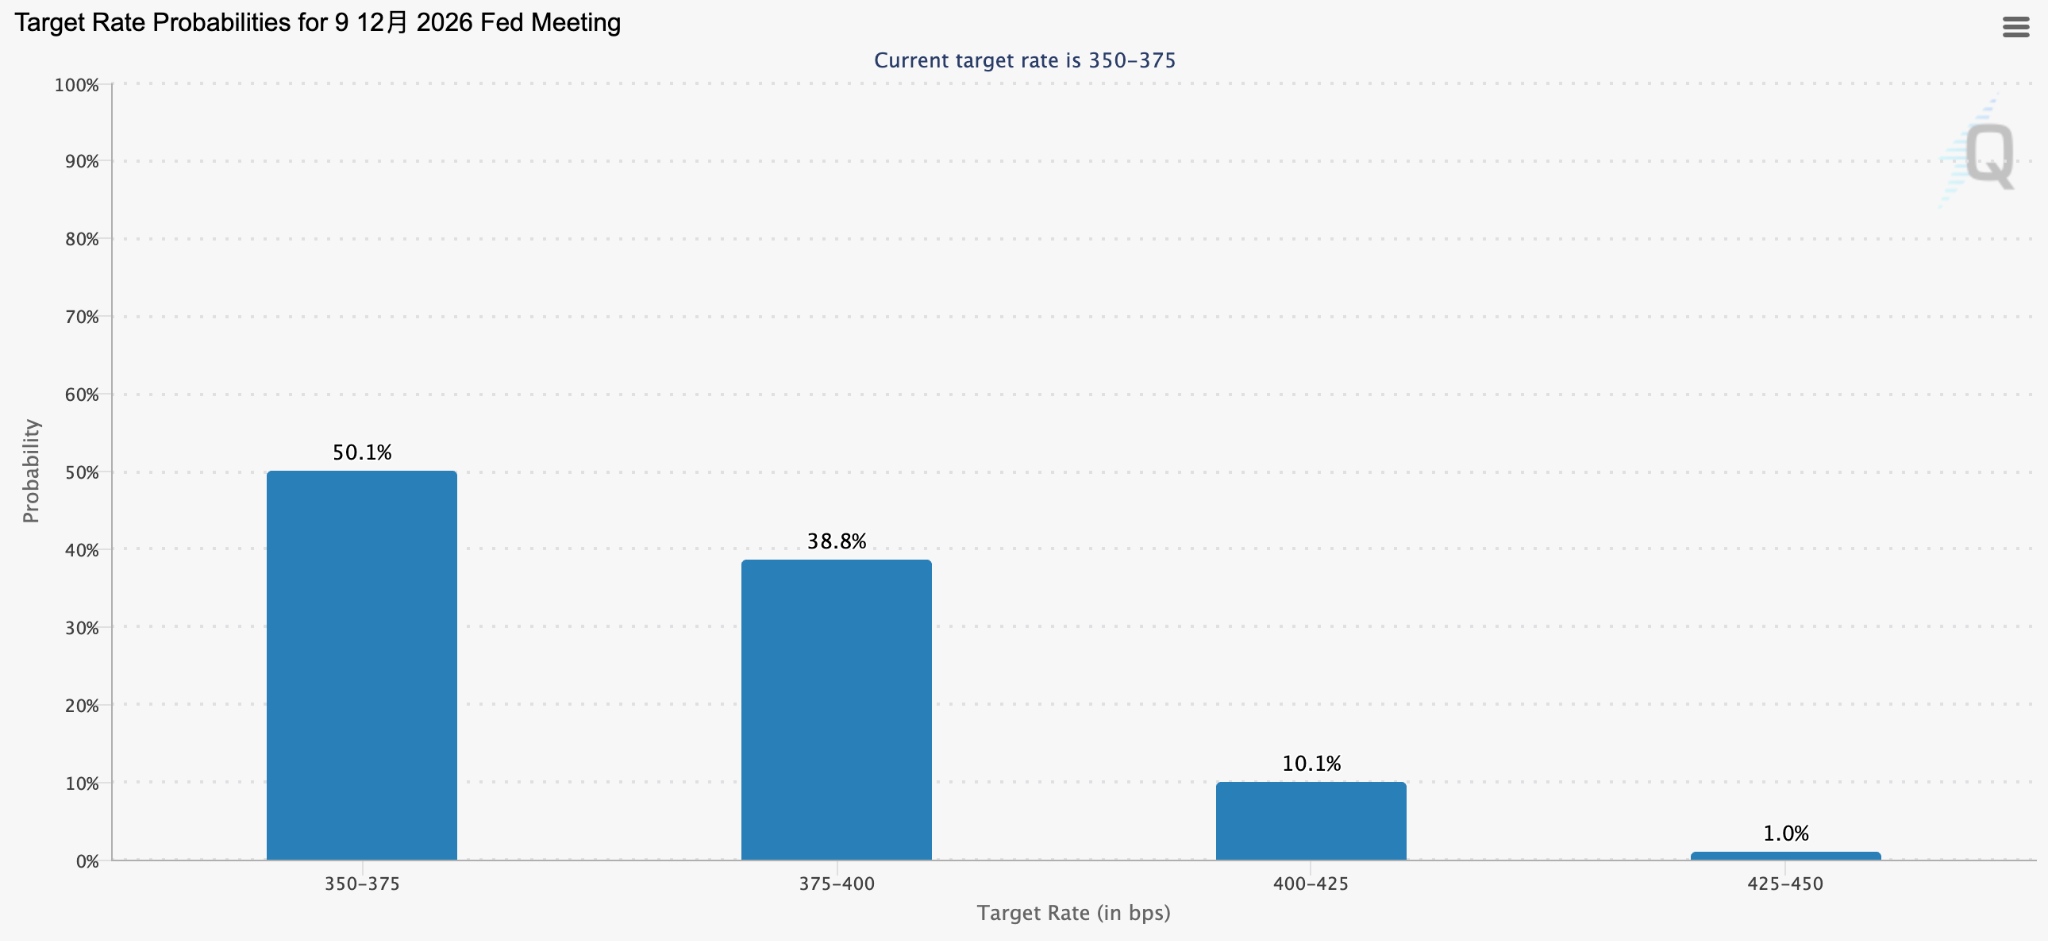
[The market once bet on a rate hike within the year; Source: CME FedWatch]
Before Warsh has even chaired his first policy meeting, the bond market has already brought "rate hikes" to the forefront on his behalf.
As of May 14, the probability of a 25-basis-point rate hike in December as priced by the market has risen to over 38%, and the 2-year Treasury yield has crossed 4%, exceeding the upper limit of the Fed's target range of 3.5% to 3.75%.
Ed Yardeni, president of Yardeni Research, stated bluntly that the 2-year yield being higher than the federal funds rate is a clear signal from the market: the current interest rate level is insufficient to curb inflation, and the Fed may have to raise rates.
Vivek Paul, Head of Global Portfolio Research at the BlackRock Investment Institute, admitted: "Bond prices are being repriced because the market expects rates to stay higher for longer, or there won't be as many rate cuts, which I think is a reasonable inference."
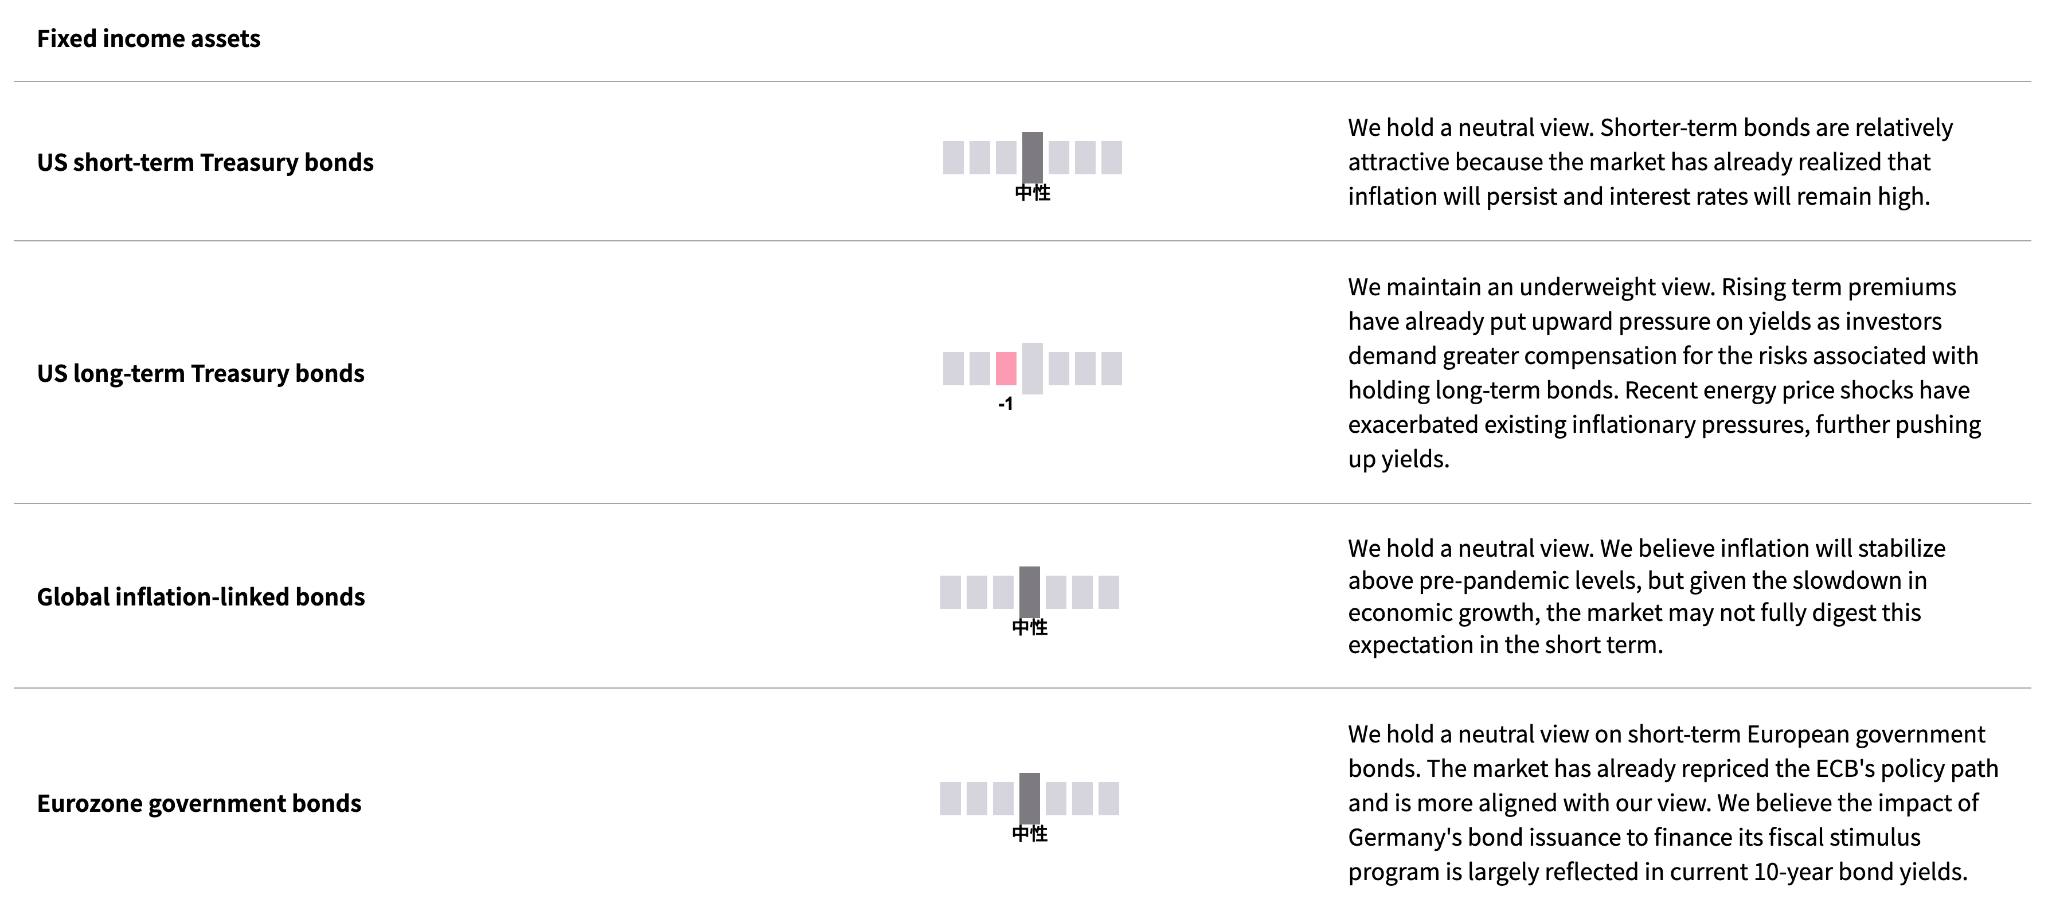
BlackRock Investment Institute has maintained an underweight position on long-term U.S. Treasuries as energy shocks drive up term premiums.
What is driving the selling pressure in the bond market?
In addition to inflation and policy expectations, the U.S. Treasury market faces a triple squeeze from supply and demand dynamics:
Hedge funds are liquidating curve-steepening trades in a concentrated fashion. Significant capital had previously bet on a widening spread between 2-year and 30-year yields (curve steepening). Inflation and robust economic data have upended this logic, leading to large-scale forced liquidations that amplified the upward move in yields.
Treasury issuance remains consistently high. For over a year, the Treasury has maintained the phrasing that issuance sizes will remain unchanged for "at least the next several quarters." Brandywine portfolio manager Jack McIntyre warns that if the wording changes to "several quarters," the market will interpret it as a signal that the restraint on issuance is about to be lifted, potentially accelerating a sell-off.
Overseas official demand is weakening at the margin. The precedent of freezing Russian assets has undermined the absolute trust some central banks have in dollar assets. If major holders such as China and Japan begin systematic divestment or slow their accumulation, the supply-demand balance of the U.S. Treasury market will be completely upended. According to the latest U.S. Treasury data, China's holdings of U.S. debt have fallen to $693.3 billion, near their lowest level since 2008.
A JPMorgan survey shows that bearish sentiment in the U.S. Treasury market continues to rise, with short positions reaching their highest level in 13 weeks.
Steven Barrow, head of strategy at Standard Bank, predicts that the 10-year U.S. Treasury yield will break 5% this year, more than 50 basis points above current levels. Open interest in 10-year Treasury futures continues to contract, reflecting a market in a deep "wait-and-see" state.
The 4.5% yield on the 10-year note was once viewed by the market as the policy tolerance ceiling for the Trump administration; current price action is testing whether this boundary has become obsolete.
If yields continue to climb, risks will spill over from the bond market to broader financial assets: lending rates will rise, high-valuation growth stocks will face systematic valuation compression, and the valuation foundations of tech stocks in long-term DCF models will be steadily eroded.
As the 2-year yield breaks above 4%, the final window for the Fed to cut rates is closing rapidly. Systemic financial tightening driven by the bond market may become the primary market narrative in the second half of 2026.
Recommended Articles


