Avalanche Price Prediction: AVAX targets $50 as BTC rally lifts Ethereum rivals

Source Fxstreet
  • Avalanche (AVAX) price broke above $43 on Monday as Bitcoin’s rally to $100,000 lifted altcoin markets. 
  • AVAX whale wallets recorded positive net inflows for 21 trading days since December 15, making acquisitions worth $600 million. 
  • The RSI technical indicator shows AVAX is approaching market saturation, as the latest price surge coincides with declining trading volumes. 

AVAX price breached the $40 resistance on Monday, driven by the crypto market's positive start to 2025. While on-chain data shows rising demand from large investors on the Avalanche network, technical indicators flash cautionary signals.  

AVAX price surges 25% as Bitcoin rally enters day 6

AVAX has emerged as one of the standout performers amid the crypto markets’s ongoing bullish start to 2025.

Against the backdrop of positive speculations on United States (US) President-elect Donald Trump’s inauguration and dovish macroeconomic tweaks, the Avalanche’ teams recent $250 million fundraising has also attracted investor attention. 

Consequently, AVAX price action has mirrored BTC in the past week, delivering more than threefold gains. 

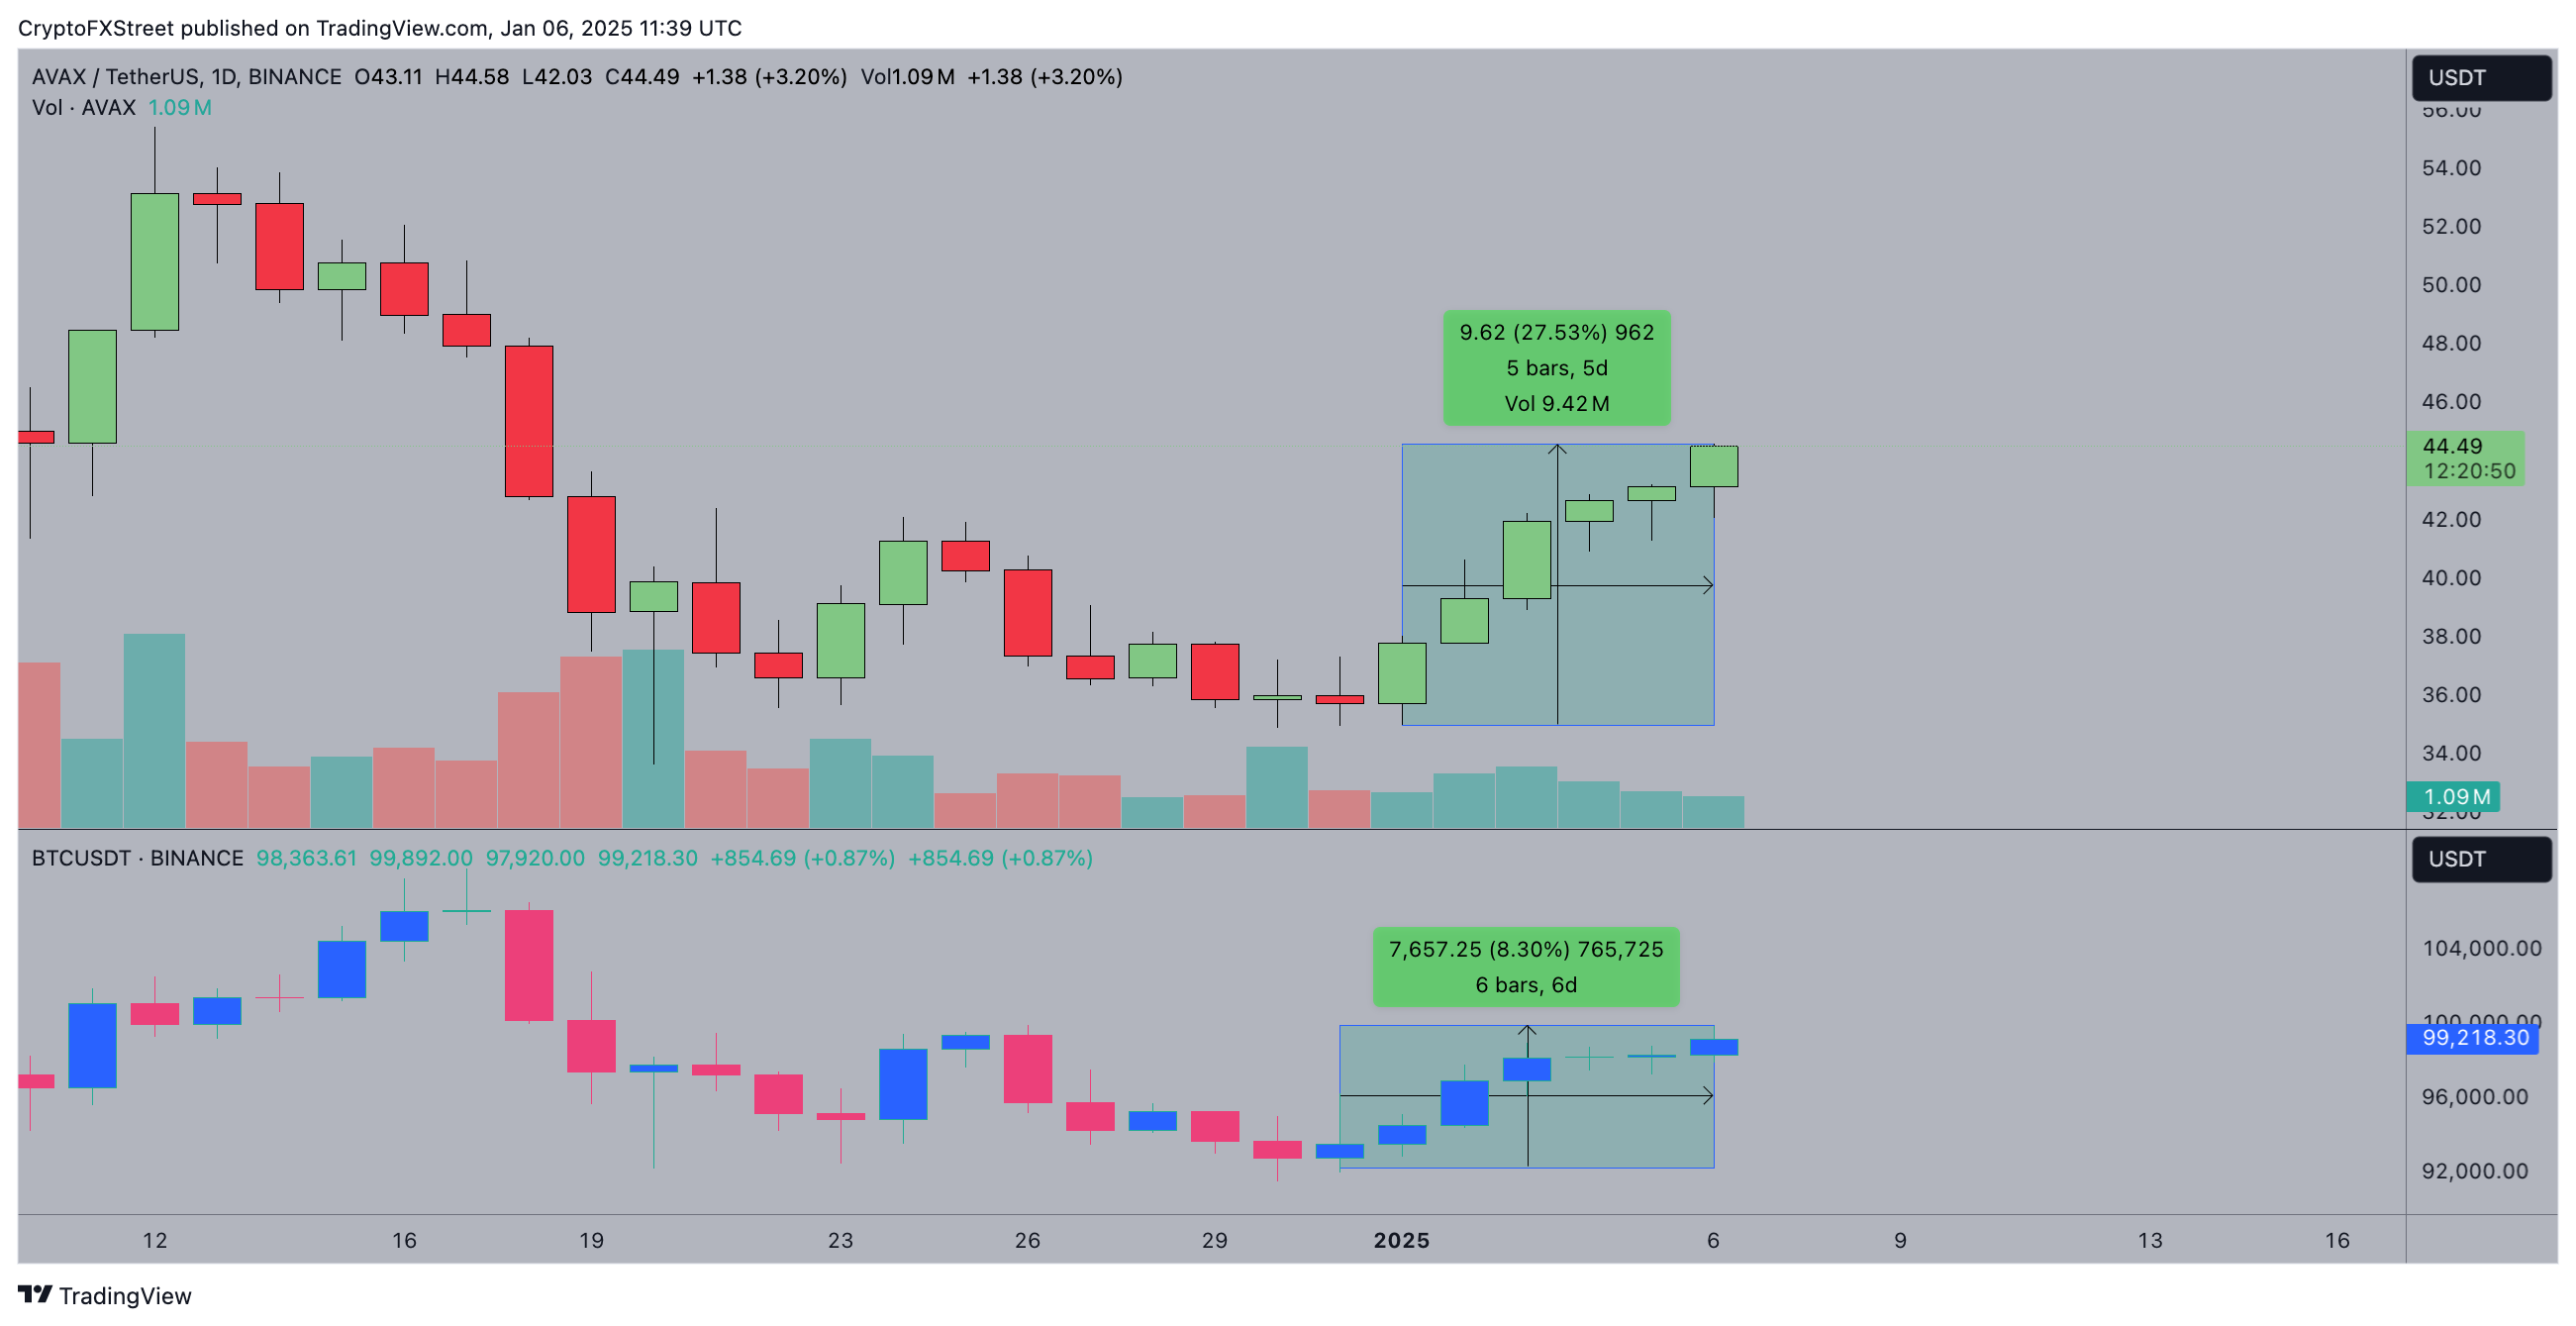
Avalanche Price Action vs. Bitcoin (BTC) 

The chart above shows the AVAX price climbed 27.8% since the start of 2025, tracking Bitcoin’s 8% gains between December 31 and January 6. 

This shows that while Ethereum’s rally has been subdued below the $3,700 mark, investors have increasingly leaned towards rival layer-1 coins.

This has seen the likes of AVAX and Cardano (ADA) above the $40 and $1 levels respectively on Monday. 

With AVAX price having breached the $45 resistanceon Monday, bulls could potentially set sights on another leg-up towards $50. 

AVAX whales spotted moving $600M in 21-day buying streak

When a mega-cap asset like AVAX  closely aligns with Bitcoin’s price, as observed in the past week, it signals strong positive sentiment among existing investors.

On-chain data trends reveal that whale wallets have been acquiring large amounts of AVAX coins since mid-December after the Avalanche team announced a $250 million fundraise for network updates.  

Confirming this narrative, IntoTheBlock’s Large Holder Netflow chart tracks the daily changes in balances of whale wallets holding at least 0.1% of total AVAX supply in circulation. 

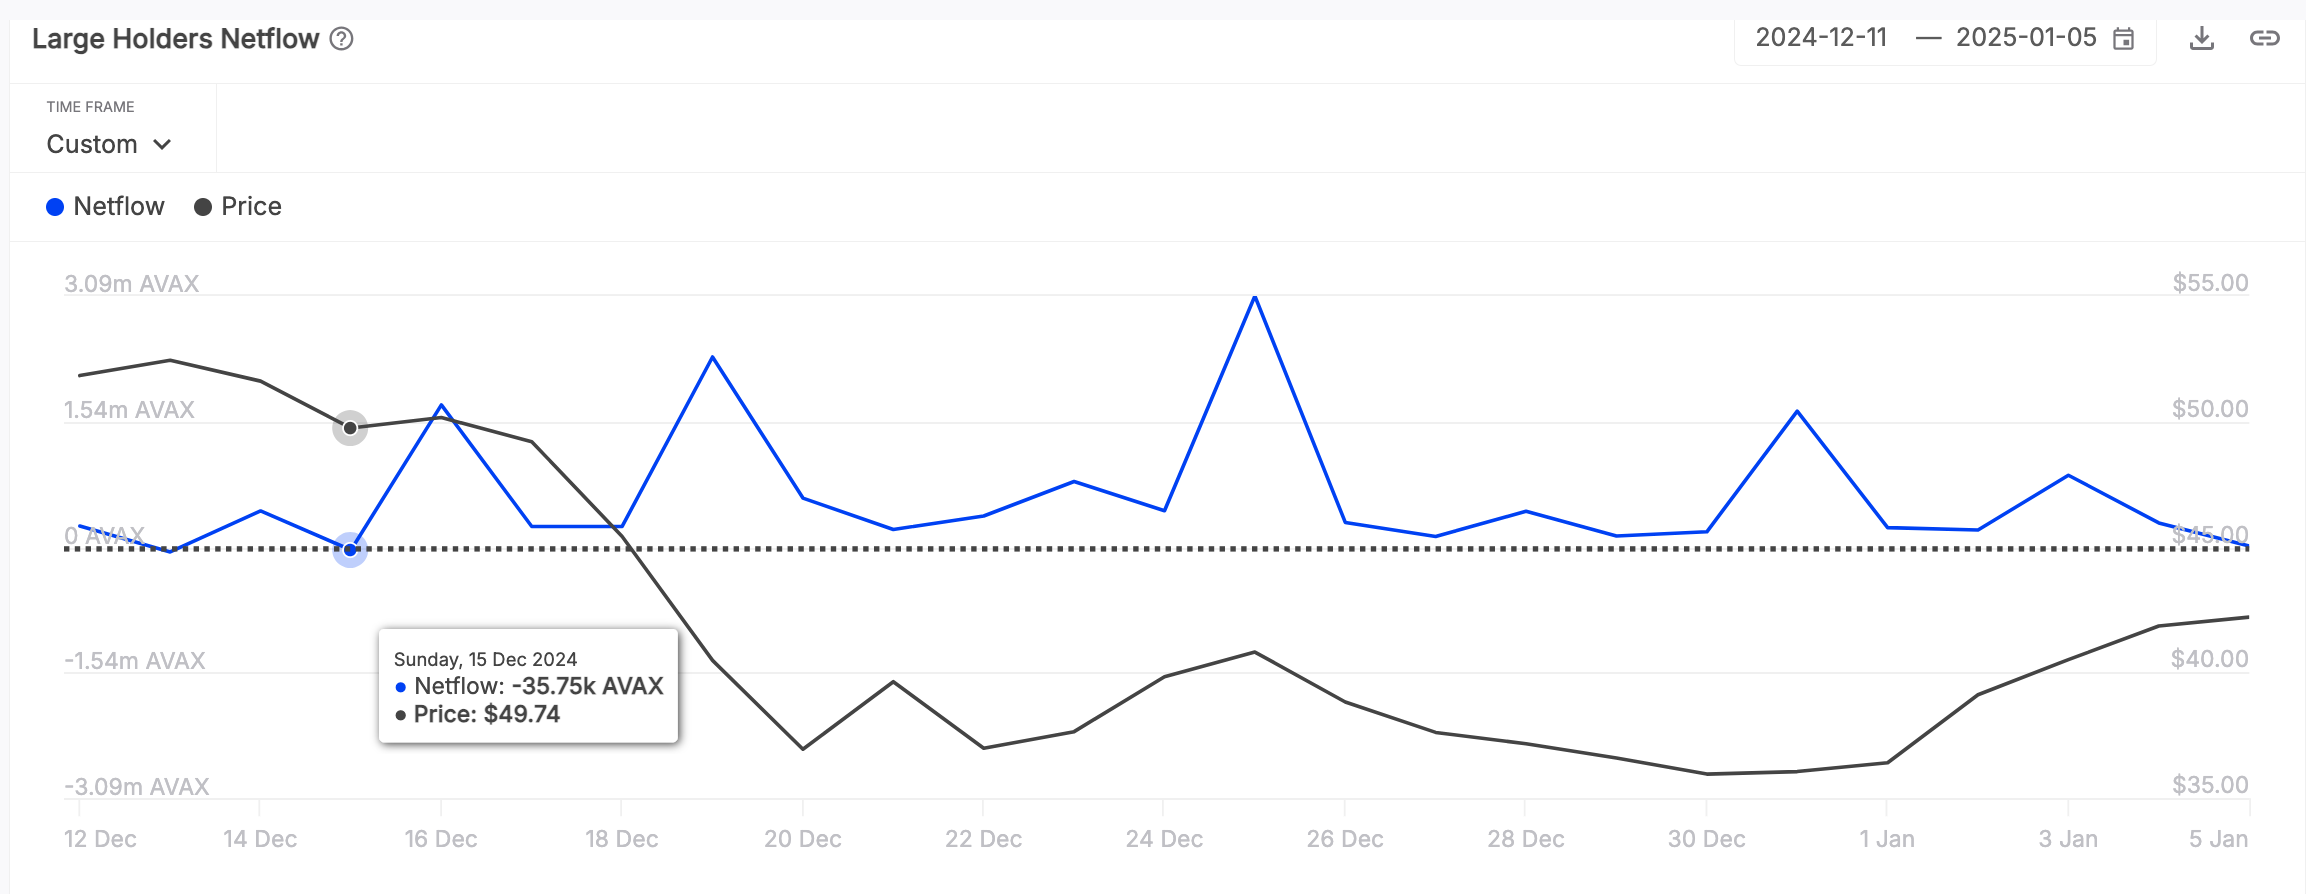
Avalanche Large Holders’ Netflow | Source: IntoTheBlock 

The chart above shows that AVAX whales have recorded positive netflow in the last 21 trading days between December 16 and January 5.

During that period, the whale wallets acquired 14.6 million AVAX worth approximately $595.6 million. 

Market reports suggest the whales entered a buying spree in reaction to the Avalanche team’s announcement of a $250 million fundraise on December 12, defying the year-end market downturn.

Evidently, the persistent buying pressure from Avalanche whales has been pivotal to AVAX price tracking the BTC rally as market sentiment recovered at the turn of the year. 

Avalanche Price Forecast: $50 sell-wall calls for caution 

Backed by strong whale demand, Avalanche price extended its year-to-date gains to 28%, breaking past the $45 resistance on Monday.

However, after five consecutive green candles, technical indicators on the AVAX/USD daily chart suggest caution as the broader crypto market rally nears potential exhaustion.

Despite the bullish momentum, AVAX trading volumes on Binance have declined over the past three days.

This divergence between rising prices and falling volume often signals weakening buyer enthusiasm, indicating the market could be approaching a local top.

Adding to this, the RSI is approaching the 60 level, a zone where previous rallies have stalled, further hinting at potential reversal risks ahead.

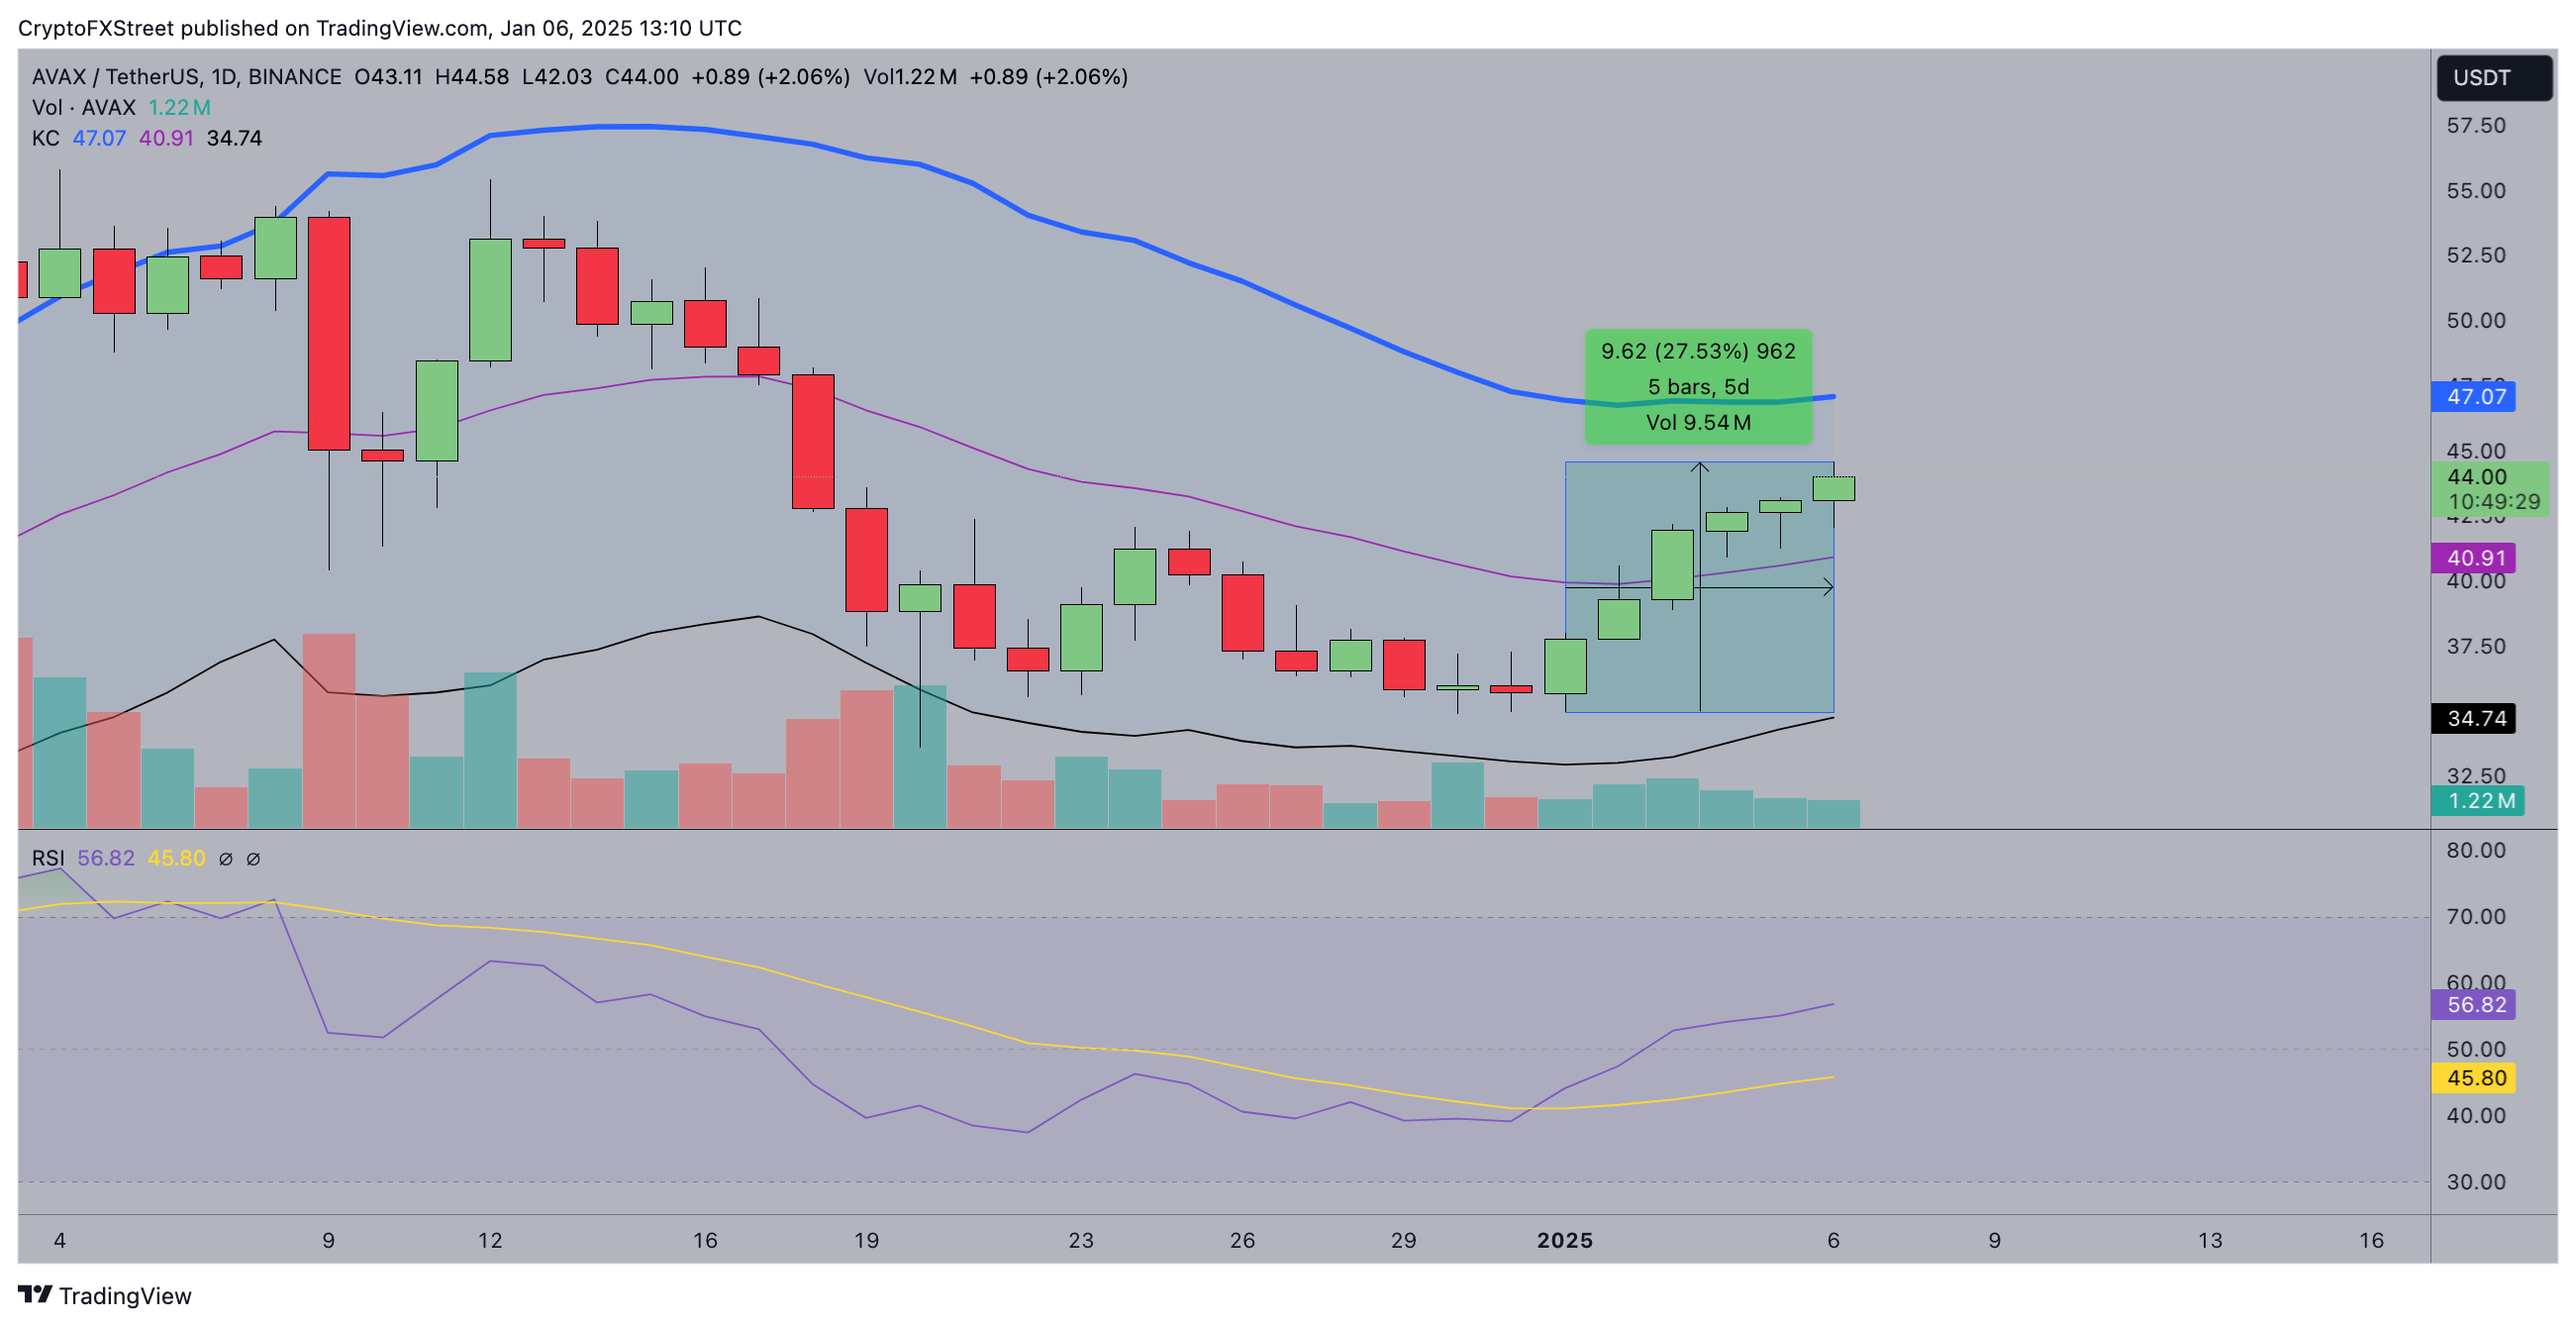
AVAX Price Forecsast | AVAXUSD

The Keltner Channel upper band at $47 marks the next major resistance level.

Failure to attract higher volumes and liquidity could result in AVAX facing rejection from $47, triggering a pullback toward the midline Keltner level at $41.

Conversely, a daily close above $47 would invalidate the cautious outlook, potentially paving the way for a breakout above $50.

Disclaimer: For information purposes only. Past performance is not indicative of future results.
placeholder
U.S. November Nonfarm Payrolls: What Does the Rare "Weak Jobs, Strong Economy" Mix Mean for U.S. Equities?1. IntroductionAfter retreating from the late-October highs, U.S. equities embarked on a bottoming rebound in mid-to-late November, a trend driven by the interplay of multiple factors. That said, it i
Author  TradingKey
7 hours ago
1. IntroductionAfter retreating from the late-October highs, U.S. equities embarked on a bottoming rebound in mid-to-late November, a trend driven by the interplay of multiple factors. That said, it i
placeholder
Senate Delays Crypto Market Structure Hearings to Early 2026The Senate Banking Committee has postponed cryptocurrency market structure hearings until 2026, citing ongoing bipartisan negotiations.
Author  Mitrade
12 hours ago
The Senate Banking Committee has postponed cryptocurrency market structure hearings until 2026, citing ongoing bipartisan negotiations.
placeholder
Bitcoin Slides 5% as Sellers Lean In — Can BTC Reclaim $88,000?Bitcoin has dropped back below $88,000 after rolling over from $90,500, with price still trading under the 100-hour Simple Moving Average. The sell-off found a floor at $85,151, and BTC is now consolidating near that base, but rebounds are facing pressure from a bearish trend line around $89,000. Bulls need to retake $88,000–$89,000 to ease downside risk; failure to do so keeps $85,500–$85,000 and then $83,500 in play, with $80,000 as the deeper “line in the sand.” Bitcoin (BTC) is back in damage-control mode after a sharp pullback wiped out recent gains. The price failed to reclaim the $90,000–$90,500 band, rolled over, and slid through $88,500 before briefly dipping under $87,000. Buyers did show up around $85,000, but the rebound so far looks more like stabilization than a clear trend reversal. Bitcoin dips hard, finds a bid near $85,000(h3) BTC’s latest move lower began when it couldn’t build follow-through above $90,000 and $90,500. Once that upside stalled, sellers took control and pushed price down through $88,500. The slide accelerated enough to spike below $87,000, but the market didn’t free-fall. Bulls defended the $85,000 zone, printing a low at $85,151. Since then, Bitcoin has been consolidating below the 23.6% Fibonacci retracement of the drop from the $93,560 swing high to the $85,151 low — a clue that the bounce is still shallow and that sellers haven’t fully backed off yet. Structurally, BTC is still on the back foot: It’s trading below $88,000, and It remains below the 100-hour Simple Moving Average, keeping short-term trend pressure pointed downward. Resistance is layered, and $89,000 is the problem area(h3) If bulls try to turn this into a recovery, they’ll have to climb through multiple ceilings in quick succession. First, BTC faces resistance around $87,150, followed by a more meaningful barrier near $87,500. From there, the market’s attention snaps back to $88,000 — the level BTC just lost and now needs to reclaim. A close back above $88,000 would improve the tone, but it doesn’t solve the bigger issue: there’s a bearish trend line on the hourly BTC/USD chart (Kraken feed) with resistance near $89,000, which also lines up with the next technical hurdle. If BTC can push through $89,000 and hold, the rebound could extend toward $90,000, with follow-through targets at $91,000 and $91,500. But until price clears that $88,000–$89,000 zone, rallies are at risk of being sold rather than chased. If BTC fails to reclaim resistance, the downside path is clear(h3) The near-term bear case is simple: if Bitcoin can’t climb back above the $87,000 area and keep traction, sellers may attempt another leg lower. Support levels line up like this: Immediate support: $85,500 First major support: $85,000 Next support: $83,500 Then $82,500 in the near term Below that, the major “don’t break this” level is still $80,000. If BTC slips under $80,000, the risk of acceleration to the downside increases significantly — not because it’s magic, but because it’s the kind of psychological and structural level that tends to trigger forced de-risking. Indicators: momentum still leans bearish(h3) The intraday indicators aren’t offering much comfort yet: Hourly MACD is losing pace in the bearish zone. Hourly RSI remains below 50, suggesting sellers still have the upper hand on short timeframes. So while the $85,000 defense held for now, the market hasn’t flipped bullish — it’s just stopped bleeding.
Author  Mitrade
15 hours ago
Bitcoin has dropped back below $88,000 after rolling over from $90,500, with price still trading under the 100-hour Simple Moving Average. The sell-off found a floor at $85,151, and BTC is now consolidating near that base, but rebounds are facing pressure from a bearish trend line around $89,000. Bulls need to retake $88,000–$89,000 to ease downside risk; failure to do so keeps $85,500–$85,000 and then $83,500 in play, with $80,000 as the deeper “line in the sand.” Bitcoin (BTC) is back in damage-control mode after a sharp pullback wiped out recent gains. The price failed to reclaim the $90,000–$90,500 band, rolled over, and slid through $88,500 before briefly dipping under $87,000. Buyers did show up around $85,000, but the rebound so far looks more like stabilization than a clear trend reversal. Bitcoin dips hard, finds a bid near $85,000(h3) BTC’s latest move lower began when it couldn’t build follow-through above $90,000 and $90,500. Once that upside stalled, sellers took control and pushed price down through $88,500. The slide accelerated enough to spike below $87,000, but the market didn’t free-fall. Bulls defended the $85,000 zone, printing a low at $85,151. Since then, Bitcoin has been consolidating below the 23.6% Fibonacci retracement of the drop from the $93,560 swing high to the $85,151 low — a clue that the bounce is still shallow and that sellers haven’t fully backed off yet. Structurally, BTC is still on the back foot: It’s trading below $88,000, and It remains below the 100-hour Simple Moving Average, keeping short-term trend pressure pointed downward. Resistance is layered, and $89,000 is the problem area(h3) If bulls try to turn this into a recovery, they’ll have to climb through multiple ceilings in quick succession. First, BTC faces resistance around $87,150, followed by a more meaningful barrier near $87,500. From there, the market’s attention snaps back to $88,000 — the level BTC just lost and now needs to reclaim. A close back above $88,000 would improve the tone, but it doesn’t solve the bigger issue: there’s a bearish trend line on the hourly BTC/USD chart (Kraken feed) with resistance near $89,000, which also lines up with the next technical hurdle. If BTC can push through $89,000 and hold, the rebound could extend toward $90,000, with follow-through targets at $91,000 and $91,500. But until price clears that $88,000–$89,000 zone, rallies are at risk of being sold rather than chased. If BTC fails to reclaim resistance, the downside path is clear(h3) The near-term bear case is simple: if Bitcoin can’t climb back above the $87,000 area and keep traction, sellers may attempt another leg lower. Support levels line up like this: Immediate support: $85,500 First major support: $85,000 Next support: $83,500 Then $82,500 in the near term Below that, the major “don’t break this” level is still $80,000. If BTC slips under $80,000, the risk of acceleration to the downside increases significantly — not because it’s magic, but because it’s the kind of psychological and structural level that tends to trigger forced de-risking. Indicators: momentum still leans bearish(h3) The intraday indicators aren’t offering much comfort yet: Hourly MACD is losing pace in the bearish zone. Hourly RSI remains below 50, suggesting sellers still have the upper hand on short timeframes. So while the $85,000 defense held for now, the market hasn’t flipped bullish — it’s just stopped bleeding.
placeholder
AUD/USD remains depressed below mid-0.6600s; downside seems limited ahead of US NFP reportThe AUD/USD pair attracts some sellers for the fourth straight day on Tuesday and trades around the 0.6630 region, down just over 0.10%, during the Asian session.
Author  FXStreet
16 hours ago
The AUD/USD pair attracts some sellers for the fourth straight day on Tuesday and trades around the 0.6630 region, down just over 0.10%, during the Asian session.
placeholder
Macro Analysts: Hawkish Japan Could Push Bitcoin Below $70KAnalysts predict Bitcoin may face further declines towards the $70,000 mark if the Bank of Japan raises interest rates as expected.
Author  Mitrade
Yesterday 05: 48
Analysts predict Bitcoin may face further declines towards the $70,000 mark if the Bank of Japan raises interest rates as expected.
goTop
quote