


Bitcoin Price Forecast: BTC slides as whale sell-off outweighs Powell’s dovish remarks
- Bitcoin trades lower on Monday after rejection from its previously broken trendline.
- BTC retreats nearly 10% from its record high, despite dovish comments from Fed Chair Jerome Powell on Friday.
- Whale and institutional sell-off intensifies, with spot Bitcoin ETFs recording over $1 billion in outflows last week.
Bitcoin (BTC) price extends its correction, trading below $111,600 at the start of the week on Monday after being rejected from its previously broken trendline last week. BTC corrects by nearly 10% from its record high despite dovish remarks from Federal Reserve (Fed) Chair Jerome Powell at the Jackson Hole Symposium on Friday. Large whale and institutional sell-off, coupled with over $1 billion in outflows from spot Bitcoin Exchange Traded Funds (ETFs), have added pressure on the market.
BTC corrects despite Fed’s Powell dovish remarks
Bitcoin price declined more than 3% last week, reaching a low of $110,680 on Sunday. This price correction comes despite the dovish remarks from Fed Chair Jerome Powell at Jackson Hole on Friday, who said that the central bank will adopt a new policy framework of flexible inflation targeting and eliminate 'makeup' strategy for inflation. "Framework calls for a balanced approach when the central bank's goals are in tension," Powell added.
According to the CoinGlass Liquidation Map chart, a total of 164,852 traders were liquidated in the last 24 hours, resulting in a total liquidation value of over $807.54 million. BTC liquidated nearly $250 million in positions during the same period, with over 94.95% of the positions being long, indicating overly bullish positioning. The largest single liquidation occurred on OKX, where a BTC/USDT position worth $12.49 million was liquidated.
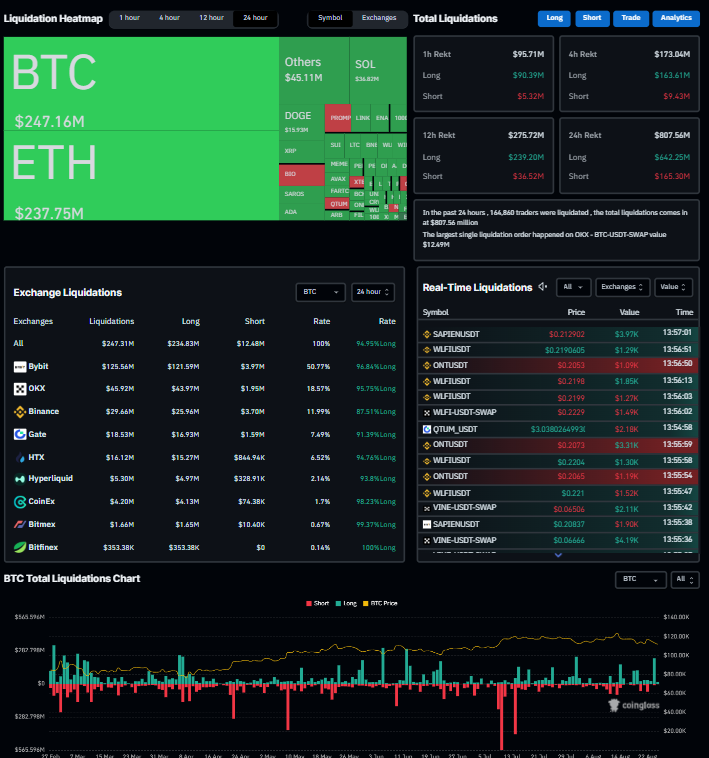
Liquidation Heatmap chart. Source: CoinGlass
Whale and institutions sell off intensities
According to Lookonchain data, the Bitcoin OG wallet, which received 100,784 BTC and is now worth $11.4 billion, has started dumping BTC for ETH. In the past five days, the wallet has deposited 22,769 BTC worth $2.59 billion to Hyperliquid for sale and bought 472,920 ETH, $2.22 billion. This sell-off had likely fueled the correction in Bitcoin price.

Apart from the large wallet sell-off, institutional investors also fueled BTC’s correction last week. SoSoValue data show that Bitcoin Spot ETFs recorded a total of $1.17 billion in weekly outflows, the highest weekly outflow since early March. If this outflow continues and intensifies, BTC could see further correction ahead.
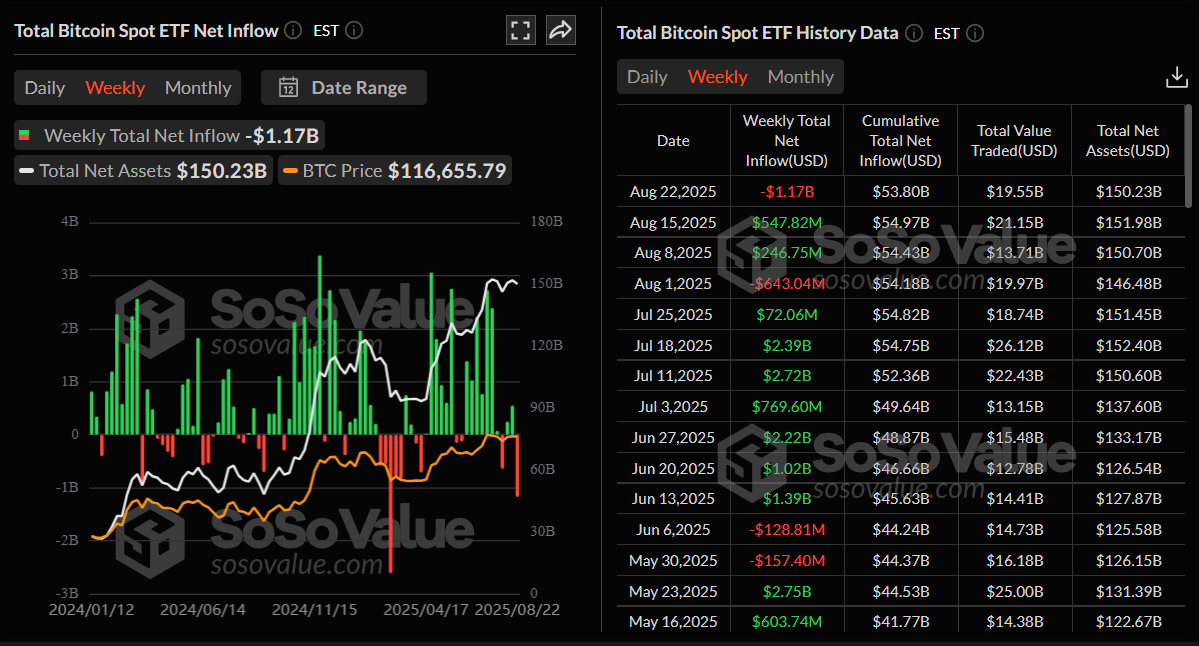
Total Bitcoin Spot ETF Net weekly inflow chart. Source: SoSoValue
Some signs of optimism
Despite large wallets and institutional investors offloading BTC and taking a cautious stance, there are some signs of optimism for Bitcoin. Japanese investment firm Metaplanet announced on Monday that it has purchased an additional 103 BTC, bringing the firm’s total holdings to 18,991 BTC, suggesting growing adoption and confidence despite price dips.

Santiment data indicate that BTC’s 30-day Market Value to Realized Value (MVRV) metric, which measures the average profit or loss of investors who acquired BTC within the last month, shows some signs of optimism.
Based on BTC’s historical chart as shown in the graph below, the trend reversal often occurs when the 30-day MVRV is around -4%, as seen on August 2. As of Monday, the metric reads -3.37% just inches away from its reversal zone. This indicates that Bitcoin is undervalued on average and suggests that if all coins were sold, most traders would realize losses at the asset’s current price.
 [12-1756111486983-1756111486985.07.38, 25 Aug, 2025].png)
BTC MVRV chart. Source: Santiment
Bitcoin Price Forecast: BTC hovers around 100-day EMA
Bitcoin price found support around the 100-day Exponential Moving Average (EMA) on Friday and rallied 3.94%. However, it found rejection from its previously broken trendline the next day and declined 3.42% until Sunday. At the time of writing on Monday, BTC trades slightly down at around $111,501.
If BTC closes below the 100-day EMA at $110,865 on a daily basis, it could extend the decline toward its next support level at $103,688, the 200-day EMA.
The Relative Strength Index (RSI) on the daily chart reads 40 after facing rejection from its neutral level of 50 on Friday, indicating increasing bearish momentum. The Moving Average Convergence Divergence (MACD) indicator showed a bearish crossover last week and supports the bearish thesis.
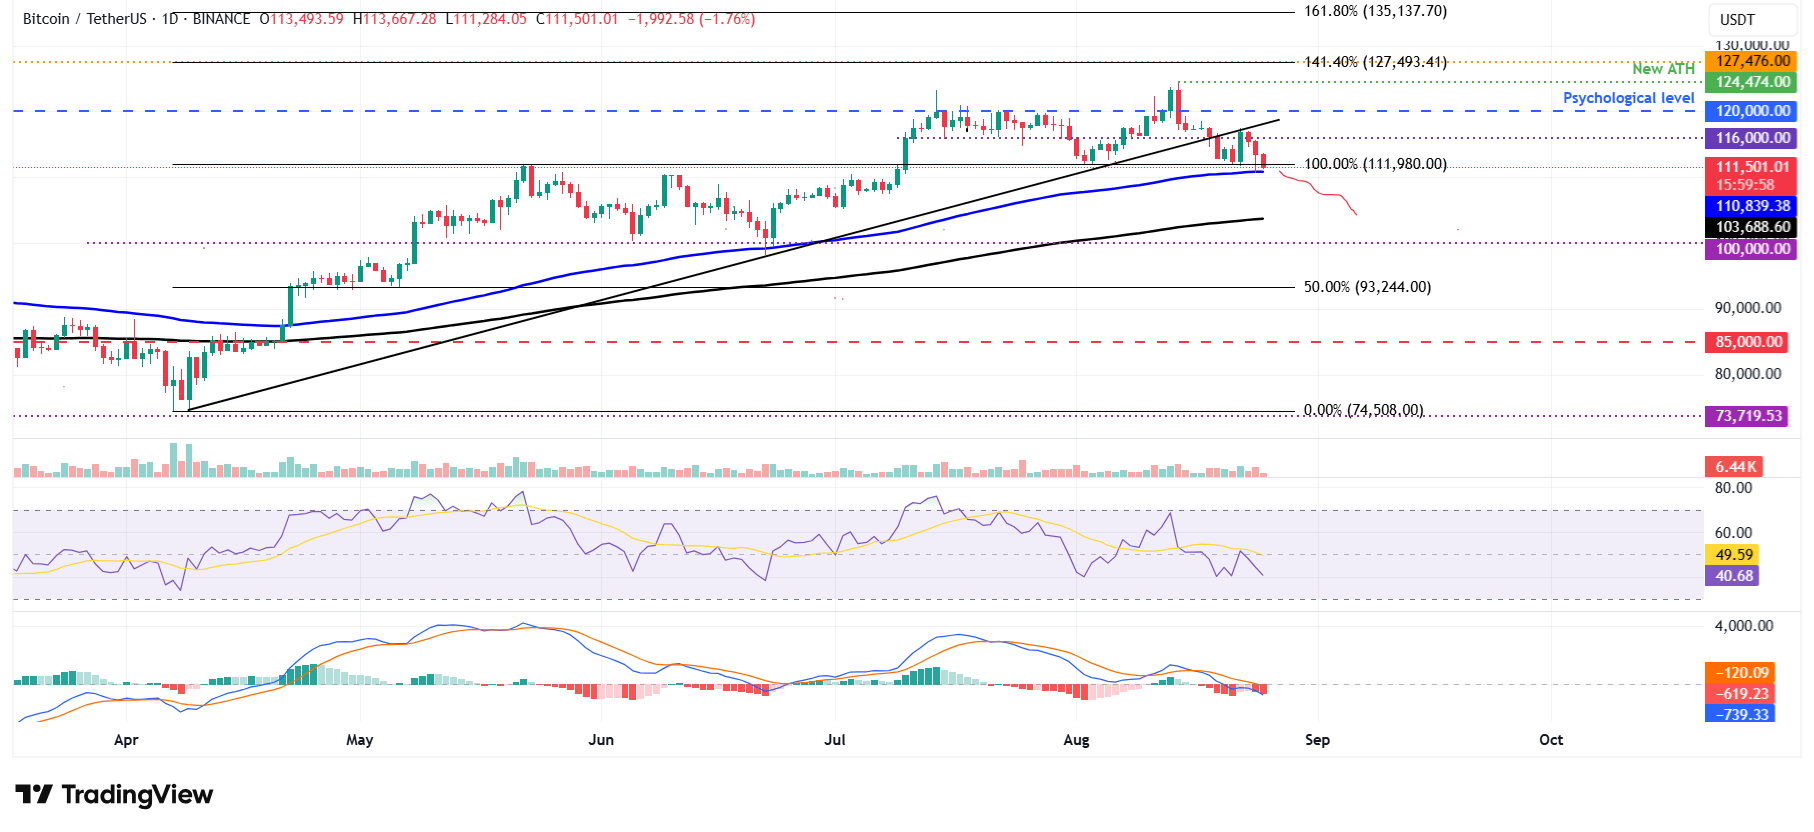
BTC/USDT daily chart
However, if BTC finds support around the 100-day EMA at $110,839 and recovers, it could extend the rally toward its key resistance at $116,000.
Bitcoin, altcoins, stablecoins FAQs
Bitcoin is the largest cryptocurrency by market capitalization, a virtual currency designed to serve as money. This form of payment cannot be controlled by any one person, group, or entity, which eliminates the need for third-party participation during financial transactions.
Altcoins are any cryptocurrency apart from Bitcoin, but some also regard Ethereum as a non-altcoin because it is from these two cryptocurrencies that forking happens. If this is true, then Litecoin is the first altcoin, forked from the Bitcoin protocol and, therefore, an “improved” version of it.
Stablecoins are cryptocurrencies designed to have a stable price, with their value backed by a reserve of the asset it represents. To achieve this, the value of any one stablecoin is pegged to a commodity or financial instrument, such as the US Dollar (USD), with its supply regulated by an algorithm or demand. The main goal of stablecoins is to provide an on/off-ramp for investors willing to trade and invest in cryptocurrencies. Stablecoins also allow investors to store value since cryptocurrencies, in general, are subject to volatility.
Bitcoin dominance is the ratio of Bitcoin's market capitalization to the total market capitalization of all cryptocurrencies combined. It provides a clear picture of Bitcoin’s interest among investors. A high BTC dominance typically happens before and during a bull run, in which investors resort to investing in relatively stable and high market capitalization cryptocurrency like Bitcoin. A drop in BTC dominance usually means that investors are moving their capital and/or profits to altcoins in a quest for higher returns, which usually triggers an explosion of altcoin rallies.
Recommended Articles


