


Dow Jones Industrial Average erases gains on renewed geopolitical tensions
- The Dow Jones fell around 500 points from the previous day’s close on Friday.
- Israel launched a surprise round of attacks on Iran late Thursday.
- The attacks, amid an already-tense Middle East, have erased the week’s gains on the Dow.
The Dow Jones Industrial Average (DJIA) fell on Friday, shedding over 600 points from the previous day’s close as investors pulled back following Israel’s unexpected wave of strikes on Iran. Consumer sentiment data rebounded more than expected, helping to ease Friday’s downside momentum.
Equity markets, riding the AI-fueled tech rally that has kept them propped up in a post-tariff environment, took the opportunity to de-risk and take a little off the top. This erased the week’s gains and snapped the Dow’s four-day winning streak.
Read more stock news: US stock indices decline after Israeli attack on Iran
The University of Michigan’s (UoM) Consumer Sentiment Index for June rose firmly over the last month, clocking in at 60.5 and handily outrunning the median market forecast of 53.5. UoM 1-year Consumer Inflation Expectations also eased, falling to 5.1% from 6.6%, while 5-year Consumer Inflation Expectations ticked down to 4.1% from 4.2%.
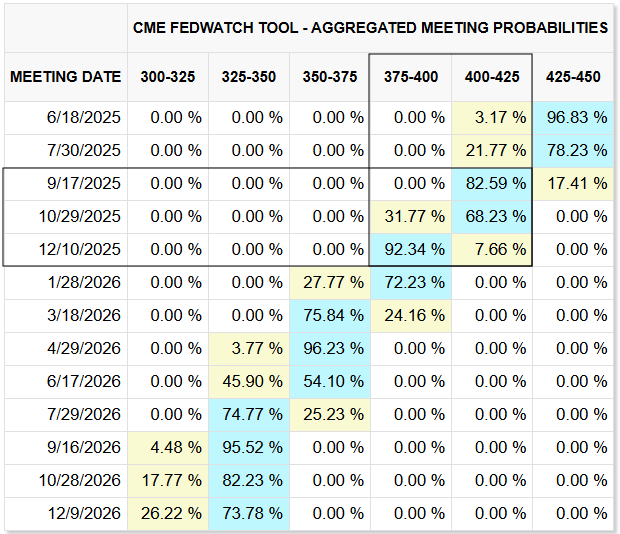
The Federal Reserve’s (Fed) latest rate call is coming up next week. The Fed is broadly expected to remain in wait-and-see mode as the central bank awaits potential fallout from the Trump administration’s whiplash approach to trade policy. Following this week’s better-than-expected inflation prints, rate markets are pricing in around 70% odds of a quarter-point cut in September, with an immediate follow-up rate trim expected in October, but more likely to come in December.
Dow Jones price forecast
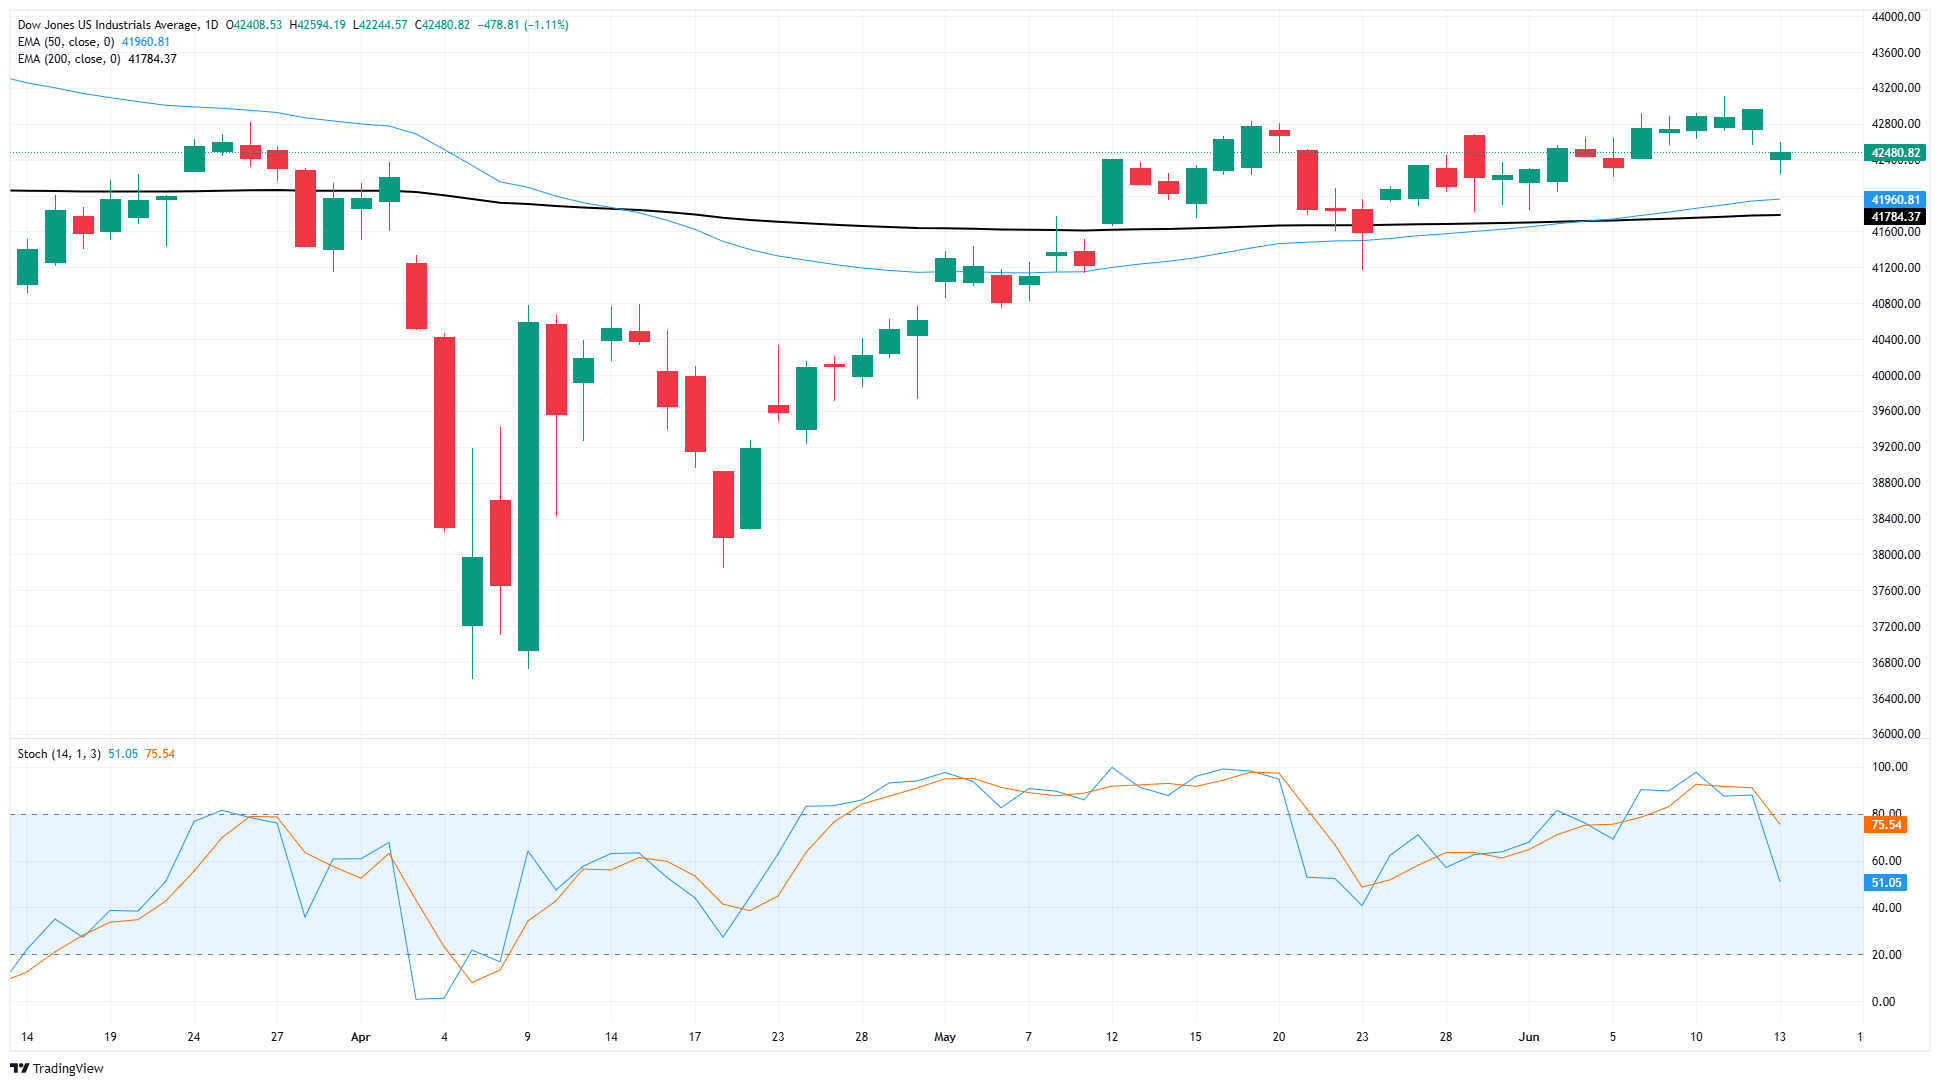
It’s been a tough week for position holders in the Dow Jones Industrial Average. After four straight days of hard-fought gains, the major equity index has tumbled back into a recent consolidation zone, putting bullish momentum on pause.
The Dow is still trading above the 200-day Exponential Moving Average (EMA) near 41,800 despite near-term weakness, and the 50-day EMA is in the process of completing a bullish cross of the long-run moving average, implying a fresh leg higher could be in the works if price action complies with technical support from the 42,000 area.
Dow Jones daily chart
Dow Jones FAQs
The Dow Jones Industrial Average, one of the oldest stock market indices in the world, is compiled of the 30 most traded stocks in the US. The index is price-weighted rather than weighted by capitalization. It is calculated by summing the prices of the constituent stocks and dividing them by a factor, currently 0.152. The index was founded by Charles Dow, who also founded the Wall Street Journal. In later years it has been criticized for not being broadly representative enough because it only tracks 30 conglomerates, unlike broader indices such as the S&P 500.
Many different factors drive the Dow Jones Industrial Average (DJIA). The aggregate performance of the component companies revealed in quarterly company earnings reports is the main one. US and global macroeconomic data also contributes as it impacts on investor sentiment. The level of interest rates, set by the Federal Reserve (Fed), also influences the DJIA as it affects the cost of credit, on which many corporations are heavily reliant. Therefore, inflation can be a major driver as well as other metrics which impact the Fed decisions.
Dow Theory is a method for identifying the primary trend of the stock market developed by Charles Dow. A key step is to compare the direction of the Dow Jones Industrial Average (DJIA) and the Dow Jones Transportation Average (DJTA) and only follow trends where both are moving in the same direction. Volume is a confirmatory criteria. The theory uses elements of peak and trough analysis. Dow’s theory posits three trend phases: accumulation, when smart money starts buying or selling; public participation, when the wider public joins in; and distribution, when the smart money exits.
There are a number of ways to trade the DJIA. One is to use ETFs which allow investors to trade the DJIA as a single security, rather than having to buy shares in all 30 constituent companies. A leading example is the SPDR Dow Jones Industrial Average ETF (DIA). DJIA futures contracts enable traders to speculate on the future value of the index and Options provide the right, but not the obligation, to buy or sell the index at a predetermined price in the future. Mutual funds enable investors to buy a share of a diversified portfolio of DJIA stocks thus providing exposure to the overall index.
Recommended Articles


