

US Dollar flat amidst more tariff uncertainty, ahead of GDP
- Markets are digesting surprise auto tariffs from US President Donald Trump.
- Traders and the Fed mull over the impact of additional tariffs being issued by Trump’s administration.
- The US Dollar Index retraces earlier gains and turns flat on Thursday.
The US Dollar Index (DXY), which tracks the performance of the US Dollar (USD) against six major currencies, is currently flat to marginally lower after paring back earlier gains at 104.49 at the time of writing on Thursday. The DXY edged higher overnight on the back of tariff comments from United States (US) President Donald Trump. An additional 25% levy on all auto imports was issued to come into effect on April 3 and countries such as Canada and the European Union were threatened with more tariffs if they look to team up in their response to the US.
On the economic data front, all eyes are shifting towards the US Gross Domestic Product (GDP) release. It will be the third reading for the fourth quarter. No big changes are expected, though nervousness could build towards the US Personal Consumption Expenditures (PCE) data due on Friday.
Daily digest market movers: GDP appetizer ahead of Friday’s PCE
- At 12:30 GMT, nearly all important data for this Thursday will be released:
- US GDP third reading of the fourth quarter of 2024:
- Headline GDP Annualized is expected to remain stable at 2.3%.
- The headline Personal Consumption Expenditures (PCE) Prices should grow steadily by 2.4%.
- The core PCE component should come in unchanged at 2.7%.
- US weekly jobless claims are expected to tick up to 225,000, coming from the previous 223,000. Continuing claims are seen picking up to 1.900 million people against 1.892 million last week.
- US GDP third reading of the fourth quarter of 2024:
- At 15:00 GMT, the Kansas Fed Manufacturing Activity data for March is due. No forecast is available with the previous reading in contraction at -5.
- At 20:30 GMT, the President of the Federal Reserve Bank of Richmond Thomas Barkin speaks about the economy to the Home Building Association of Richmond.
- Equities are two-faced this Thursday, with European ones dragging lower, infused by the imposed car tariffs for imports to the US. The US futures are marginally higher to flat on the day before the opening bell.
- According to the CME Fedwatch Tool, the probability of interest rates remaining at the current range of 4.25%-4.50% in May’s meeting is 89.7%. For June’s meeting, the odds for borrowing costs being lower stand at 63.6%.
- The US 10-year yield trades around 4.39%, ticking up as traders are heading from US Bonds into Gold again.
US Dollar Index Technical Analysis: DXY is not Gold
The US Dollar Index (DXY) is not really impressed by Trump’s recent tariff talks. The extensive moves seen in the precious metal space, such as Gold, must make US Dollar bulls jealous. Expect volatility in the DXY to start picking up once the US economic data starts to portray a much clearer picture regarding US exceptionalism, stagflation, or recession scenarios.
With the weekly close above 104.00 last week, a large sprint higher towards the 105.00 round level could still occur, with the 200-day Simple Moving Average (SMA) converging at that point and reinforcing this area as a strong resistance at 104.96. Once broken through that zone, a string of pivotal levels, such as 105.53 and 105.89, could limit the upward momentum.
On the downside, the 104.00 round level is the first nearby support after a successful bounce on Tuesday. If that does not hold, the DXY risks falling back into that March range between 104.00 and 103.00. Once the lower end at 103.00 gives way, watch out for 101.90 on the downside.
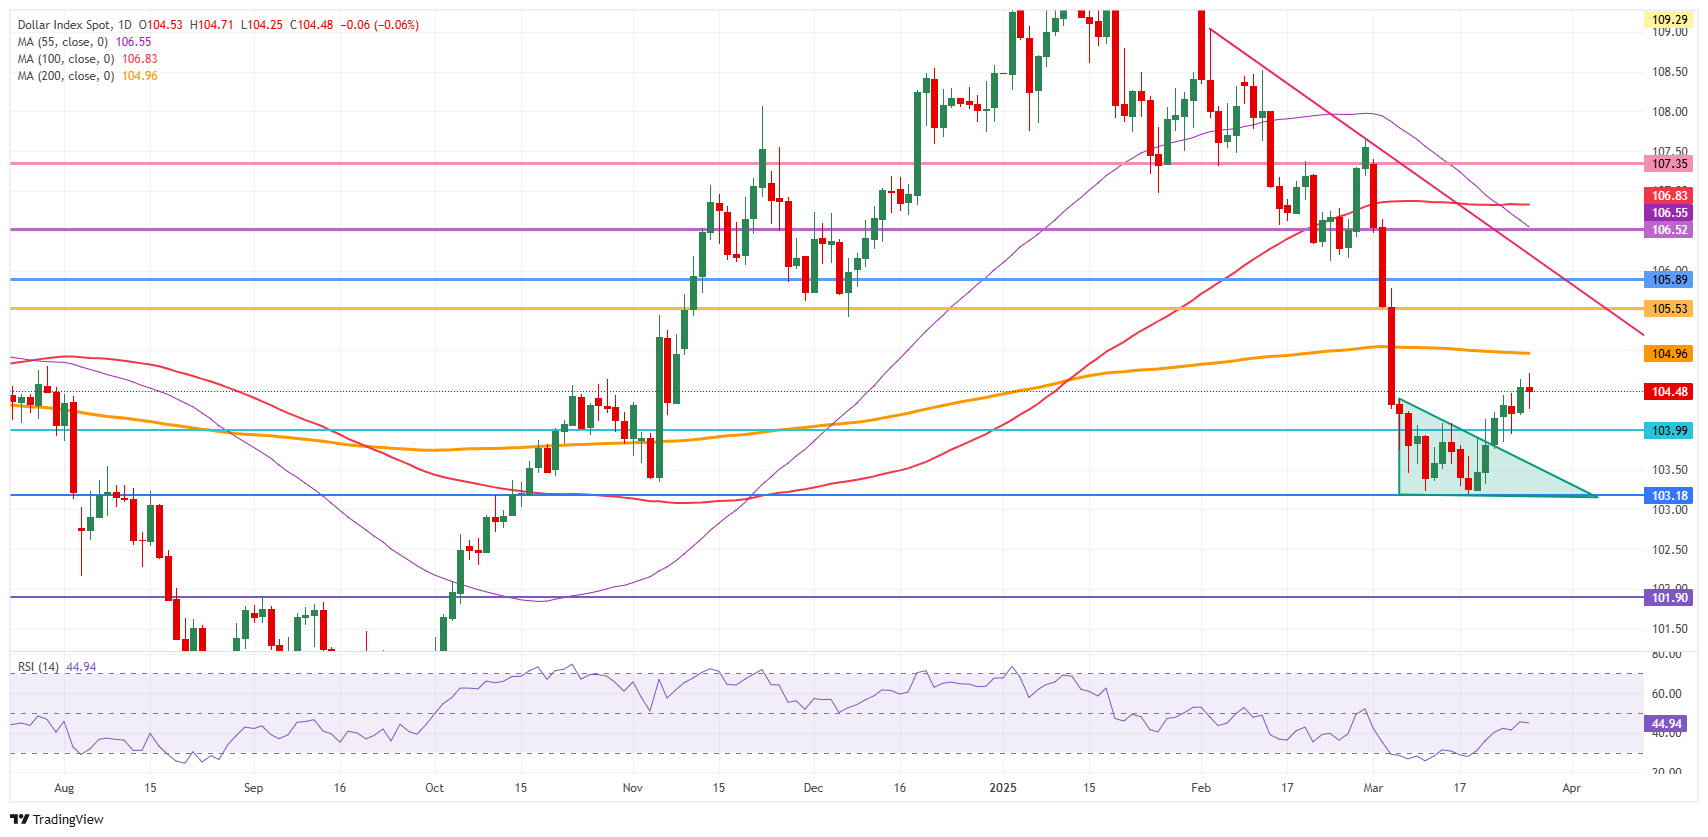
US Dollar Index: Daily Chart
US Dollar FAQs
The US Dollar (USD) is the official currency of the United States of America, and the ‘de facto’ currency of a significant number of other countries where it is found in circulation alongside local notes. It is the most heavily traded currency in the world, accounting for over 88% of all global foreign exchange turnover, or an average of $6.6 trillion in transactions per day, according to data from 2022. Following the second world war, the USD took over from the British Pound as the world’s reserve currency. For most of its history, the US Dollar was backed by Gold, until the Bretton Woods Agreement in 1971 when the Gold Standard went away.
The most important single factor impacting on the value of the US Dollar is monetary policy, which is shaped by the Federal Reserve (Fed). The Fed has two mandates: to achieve price stability (control inflation) and foster full employment. Its primary tool to achieve these two goals is by adjusting interest rates. When prices are rising too quickly and inflation is above the Fed’s 2% target, the Fed will raise rates, which helps the USD value. When inflation falls below 2% or the Unemployment Rate is too high, the Fed may lower interest rates, which weighs on the Greenback.
In extreme situations, the Federal Reserve can also print more Dollars and enact quantitative easing (QE). QE is the process by which the Fed substantially increases the flow of credit in a stuck financial system. It is a non-standard policy measure used when credit has dried up because banks will not lend to each other (out of the fear of counterparty default). It is a last resort when simply lowering interest rates is unlikely to achieve the necessary result. It was the Fed’s weapon of choice to combat the credit crunch that occurred during the Great Financial Crisis in 2008. It involves the Fed printing more Dollars and using them to buy US government bonds predominantly from financial institutions. QE usually leads to a weaker US Dollar.
Quantitative tightening (QT) is the reverse process whereby the Federal Reserve stops buying bonds from financial institutions and does not reinvest the principal from the bonds it holds maturing in new purchases. It is usually positive for the US Dollar.
Recommended Articles


