

Dow Jones Industrial Average surges after US CPI inflation print
- The Dow Jones lurched over 750 points higher on Wednesday.
- Equities are broadly pivoting into a risk-on sentiment stance.
- Investors brush off rising headline CPI as core CPI measures tick down.
The Dow Jones Industrial Average (DJIA) climbed around 750 points at its peak on Wednesday, pushing into the bullish side to pass back through the 43,000 handle before getting hung up on the 50-day Exponential Moving Average (EMA). Equity markets are tilting firmly into the bullish camp after a key core inflation gauge ticked slightly lower.
According to the Consumer Price Index (CPI), headline inflation rose in December from a year before, with prices climbing 2.9% YoY compared to 2.7% previously. The acceleration in headline inflation was anticipated by market analysts, though December’s standalone figure still surprised to the upside, coming in at 0.4% MoM compared to the expected flat hold at 0.3%.
The real magic for equity markets came in the core CPI print, which excludes volatile items liike food and energy prices. Annualized core inflation ticked down to 3.2% YoY, beating the expected hold at the previous period’s 3.3%. Choosing to ignore rising food and energy prices doesn’t mean consumers won’t magically have to stop paying for them, and investors are running the risk of getting lost in the details and focusing on the wrong thing: odds of a Federal Reserve (Fed) rate cut on January 29 moved from 2.0% to 2.7% after the CPI print, according to the CME’s FedWatch Tool.
Dow Jones news
Wednesday is turning out to be a firmly bullish day for the Dow Jones, with all but five of the average’s listed securities trading above the day’s opening bids. Honeywell International (HON) pulled back around 0.6% to $217 as investors took profits on a recent bullish upswing for the company. Goldman Sachs (GS) rose to the top of the DJIA during the midweek market session, climbing 6.5% and pushing into $604 per share after the major investment bank’s profits surged to a three-year high.
Dow Jones price forecast
The Dow Jones’ latest bearish weak point could be over as price action pushes back north of the 50-day EMA and reclaims the 43,000 handle. The major equity index pulled back into alarm bell territory just above the 200-day EMA near 41,200, but things may be back to their bullish ways now that the Dow has climbed 3.7% in just three days.
42,000 has proven to be the technical floor holding up bids, at least for the time being. Selling pressure has remained unable to push prices meaningfully back below the key figure, and bidders are coming out of the woodwork to try and push the Dow Jones back into record highs set above 45,000.
Dow Jones daily chart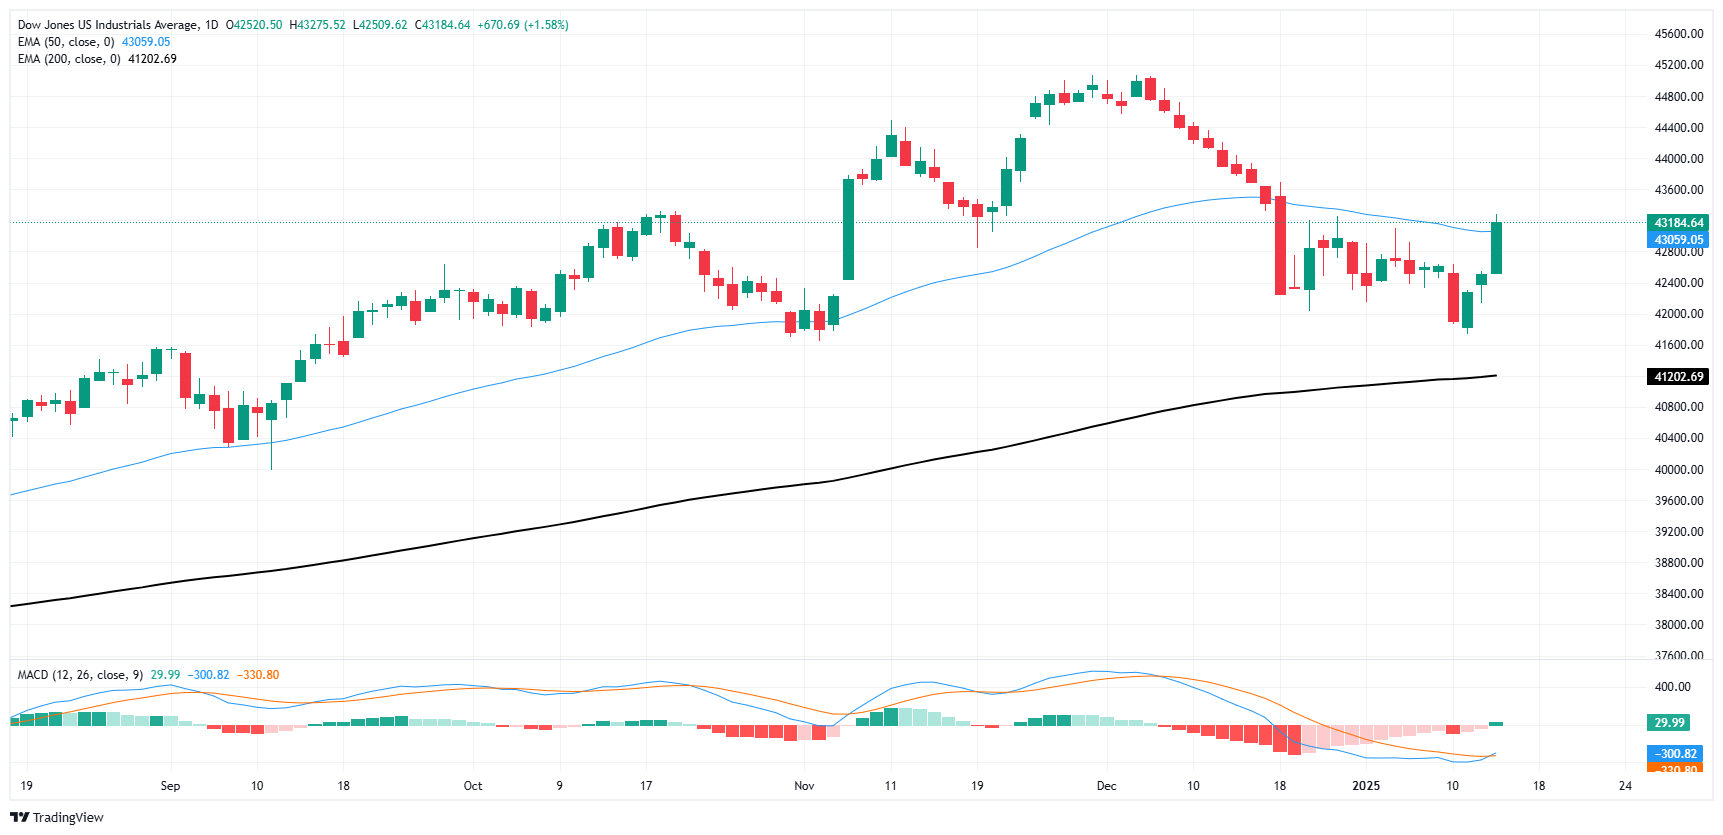
Dow Jones FAQs
The Dow Jones Industrial Average, one of the oldest stock market indices in the world, is compiled of the 30 most traded stocks in the US. The index is price-weighted rather than weighted by capitalization. It is calculated by summing the prices of the constituent stocks and dividing them by a factor, currently 0.152. The index was founded by Charles Dow, who also founded the Wall Street Journal. In later years it has been criticized for not being broadly representative enough because it only tracks 30 conglomerates, unlike broader indices such as the S&P 500.
Many different factors drive the Dow Jones Industrial Average (DJIA). The aggregate performance of the component companies revealed in quarterly company earnings reports is the main one. US and global macroeconomic data also contributes as it impacts on investor sentiment. The level of interest rates, set by the Federal Reserve (Fed), also influences the DJIA as it affects the cost of credit, on which many corporations are heavily reliant. Therefore, inflation can be a major driver as well as other metrics which impact the Fed decisions.
Dow Theory is a method for identifying the primary trend of the stock market developed by Charles Dow. A key step is to compare the direction of the Dow Jones Industrial Average (DJIA) and the Dow Jones Transportation Average (DJTA) and only follow trends where both are moving in the same direction. Volume is a confirmatory criteria. The theory uses elements of peak and trough analysis. Dow’s theory posits three trend phases: accumulation, when smart money starts buying or selling; public participation, when the wider public joins in; and distribution, when the smart money exits.
There are a number of ways to trade the DJIA. One is to use ETFs which allow investors to trade the DJIA as a single security, rather than having to buy shares in all 30 constituent companies. A leading example is the SPDR Dow Jones Industrial Average ETF (DIA). DJIA futures contracts enable traders to speculate on the future value of the index and Options provide the right, but not the obligation, to buy or sell the index at a predetermined price in the future. Mutual funds enable investors to buy a share of a diversified portfolio of DJIA stocks thus providing exposure to the overall index.
Recommended Articles


