

Dow Jones Industrial Average muddles through tech decline on Monday
- The Dow Jones is looking to pare recent losses, but topside momentum remains limited.
- Investors are pivoting out of popular tech rally favorites, dragging equity markets lower.
- The Dow is keeping on-balance as investors rotate into non-tech darlings.
The Dow Jones Industrial Average (DJIA) avoided most of Monday’s broad-market declines as investors reaffirmed their bullish outlook on the long-run tech sector rally. The Dow gained roughly 100 points to kick off the trading week, while the other major equity indexes shed weight.
Investor hopes for continued rate cuts from the Federal Reserve (Fed) have been swirling the drain since the start of the new trading year, and last Friday’s bumper Nonfarm Payrolls (NFP) sealed the deal on the Fed being in no rush to deliver more rate reductions. With a bumping US workforce and inflation pressures continuing to simmer in the background, there is little reason for the Fed to race into further moves on rates. To their credit, Fed policymakers have been warning markets for over a year that neutral rates have definitely moved higher since the pandemic and near-zero rate days of the early 2010s, and now it looks like that fact is finally taking hold in investors’ minds.
A fresh batch of US inflation figures are due this week: US Producer Price Index (PPI) inflation is due on Tuesday, and the Consumer Price Index (CPI) is slated for Wednesday. Both figures are expected to tick upwards in the near term, which could further undermine rate cut hopes. Retail Sales figures for December will land on Thursday, and the figure is expected to shift lower but remain in healthy consumer spending territory.
Dow Jones news
Despite a broad-market pullback out of tech stock, over half of the Dow Jones is testing into the high side on Monday, with gains being led by a fresh bout of bidding in Unitedhealth Group (UNH), which is recovering from a December bear run that dragged the health sector stock down from record highs above $600. UNH is up over 4% at the time of writing, breaking above $543 per share.
On the low side, Nvidia (NVDA) just can’t catch a break, declining another 2.3% and trading south of $133 per share. Forecasters of tech sector stocks, which are hinged entirely around the AI tech craze, have decided that Nvidia will miss out on future earnings in the AI space as competitors sweep in and take market share from the chipmaker. The fact that the AI tech space is entirely dependent on a massive pipeline of investment funds with little to no revenue to speak of is only a minor factor as traders focus on companies situated to service the exorbitant spending habits of large-scale data modelers driving the AI space.
The US is also expected to further curb exports of Nvidia-produced silicon wafers in a bid to limit market access to high-grade computing chips by foreign opponents to the US, further crimping Nvidia flows. Further adding to Nvidia's issues, a "glitchy" server rack problem is leading the usual NVDA customers to hold off on large-scale acquisitions of server computing solutions until Nvidia is able to push a newer version, crimping near-term sales of business services.
Dow Jones price forecast
The Dow Jones is catching a thin bid on Monday, pushing back upwards after a decline into the 42,000 handle. The major equity index has drifted nearly 7.5% top-to-bottom into the bearish side after tapping record peaks just above 45,000.
Despite recent bear moves, the Dow Jones is still holding north of the 200-day Exponential Moving Average (EMA), but only just. The Dow is due for a bit of a breather after outpacing the long-run moving average since November of 2023, and closing in the green for ten of the last thirteen straight months.
Dow Jones daily chart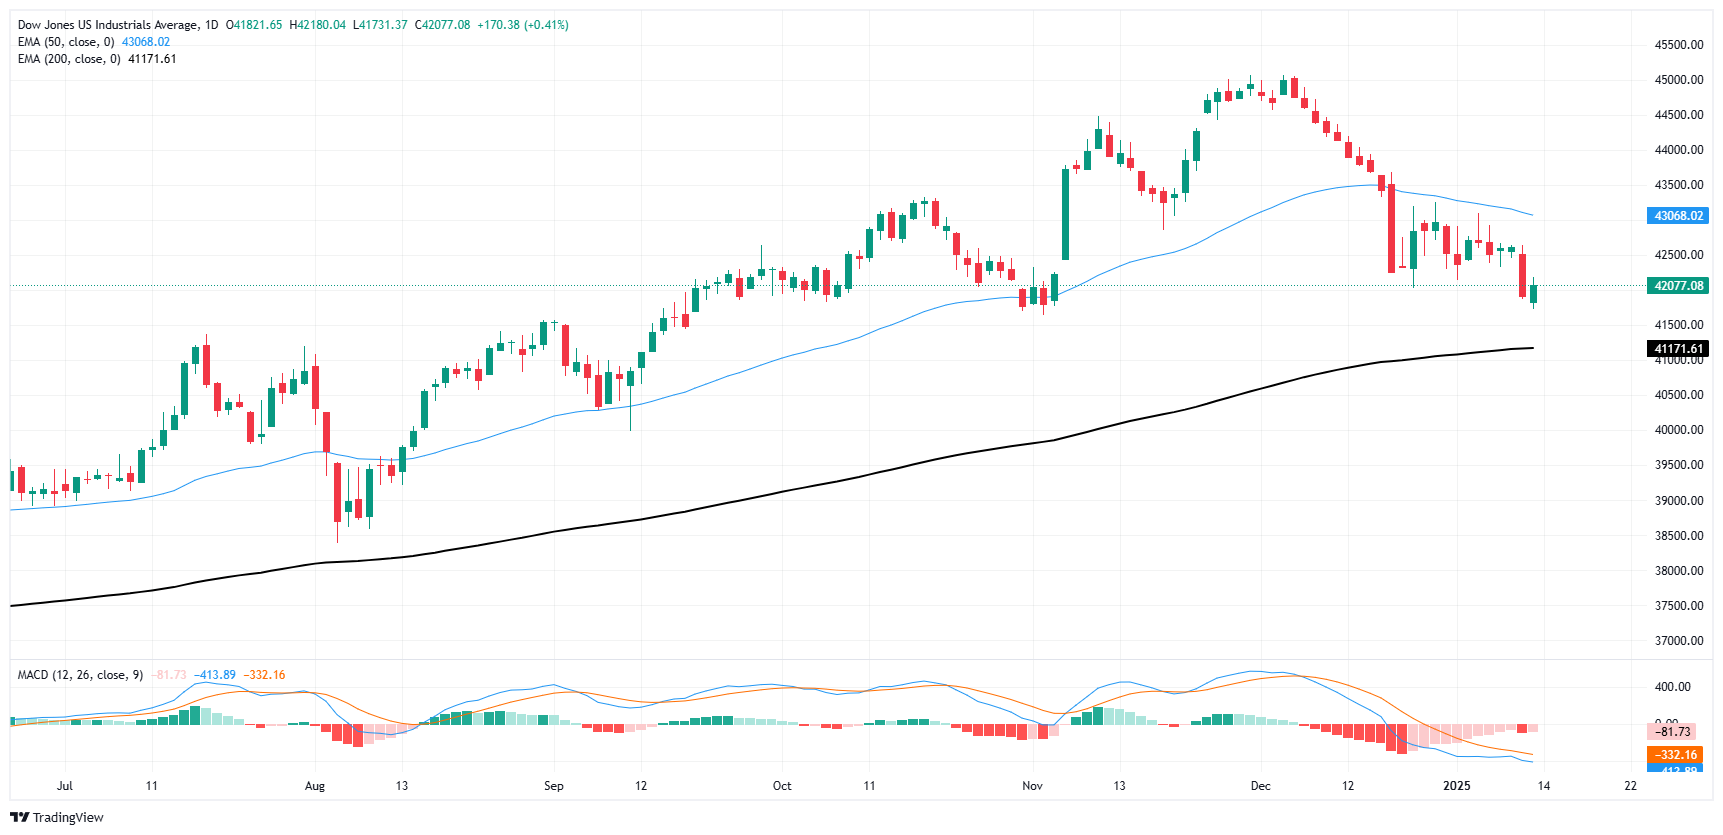
Dow Jones FAQs
The Dow Jones Industrial Average, one of the oldest stock market indices in the world, is compiled of the 30 most traded stocks in the US. The index is price-weighted rather than weighted by capitalization. It is calculated by summing the prices of the constituent stocks and dividing them by a factor, currently 0.152. The index was founded by Charles Dow, who also founded the Wall Street Journal. In later years it has been criticized for not being broadly representative enough because it only tracks 30 conglomerates, unlike broader indices such as the S&P 500.
Many different factors drive the Dow Jones Industrial Average (DJIA). The aggregate performance of the component companies revealed in quarterly company earnings reports is the main one. US and global macroeconomic data also contributes as it impacts on investor sentiment. The level of interest rates, set by the Federal Reserve (Fed), also influences the DJIA as it affects the cost of credit, on which many corporations are heavily reliant. Therefore, inflation can be a major driver as well as other metrics which impact the Fed decisions.
Dow Theory is a method for identifying the primary trend of the stock market developed by Charles Dow. A key step is to compare the direction of the Dow Jones Industrial Average (DJIA) and the Dow Jones Transportation Average (DJTA) and only follow trends where both are moving in the same direction. Volume is a confirmatory criteria. The theory uses elements of peak and trough analysis. Dow’s theory posits three trend phases: accumulation, when smart money starts buying or selling; public participation, when the wider public joins in; and distribution, when the smart money exits.
There are a number of ways to trade the DJIA. One is to use ETFs which allow investors to trade the DJIA as a single security, rather than having to buy shares in all 30 constituent companies. A leading example is the SPDR Dow Jones Industrial Average ETF (DIA). DJIA futures contracts enable traders to speculate on the future value of the index and Options provide the right, but not the obligation, to buy or sell the index at a predetermined price in the future. Mutual funds enable investors to buy a share of a diversified portfolio of DJIA stocks thus providing exposure to the overall index.
Recommended Articles


