


US Dollar steadies as traders await last Nonfarm Payrolls release of the year
- The US Dollar trades flat ahead of Nonfarm Payrolls, the most important US data release this week.
- Traders will be on edge over job creation numbers to gauge the chances of another interest-rate cut by the Fed this month.
- The US Dollar Index (DXY) resides near a one-week low at 105.75.
The US Dollar (USD) trades broadly flat on Friday ahead of the important Nonfarm Payrolls (NFP) number for November, a key indicator to gauge the health of the US labor market. Expectations of job growth have been tuned down in recent days after several Purchasing Manager Index (PMI) readings came in at or below expectations.
The employment component from the Institute for Supply Management (ISM) in both the Manufacturing and Services sectors did not portray a rosy picture ahead of the US Jobs Report. Still, market consensus points to an increase of 200,000 jobs, rebounding sharply from the meager 12,000 jobs created in October, when hurricanes and strikes distorted the figures.
Besides the Nonfarm Payrolls print, the Unemployment Rate and the Monthly Average Hourly Earnings number (all part of the same jobs report) also have the potential to move markets. Friday will end with the University of Michigan preliminary Consumer Sentiment Index reading and with four Federal Reserve officials making appearances.
Daily digest market movers: Survey ranges too elevated
- At 13:30 GMT, the US Jobs Report for November will be released:
- The Nonfarm Payrolls print is expected to come in at 200,000 against the previous 12,000 increase. The estimates vary from 135,000 on the downside to 252,000 on the upside. Any number smaller than the downside estimate will trigger a weaker US Dollar, while any number above the upside consensus will trigger substantial US Dollar strength.
- The Unemployment Rate is expected to tick up to 4.2% from 4.1%.
- The Monthly Average Hourly Earnings number is expected to ease to 0.3% from 0.4%.
- At 15:00 GMT, the University of Michigan will deliver its preliminary reading for December:
- Consumer Sentiment is expected to tick up to 73 from 71.8 previously.
- The 5-year inflation expectations rate has no consensus view and stood at 3.2% in November.
- A slew of Fed speakers will take the stage:
- Near 14:15 GMT, comments are expected from Federal Reserve Governor Michelle Bowman, who participates in a virtual conversation at the Missouri Bankers Association Executive Management Conference.
- At 15:30 GMT, Federal Reserve Bank of Chicago President Austan Goolsbee participates in a fireside chat at the 38th Economic Outlook Symposium organized by the Chicago Fed.
- Around 17:00 GMT, comments are expected from Federal Reserve Bank of Cleveland President Beth Hammack who delivers remarks about the US economic outlook at an event organized by the City Club of Cleveland.
- Federal Reserve Bank of San Francisco President Mary Daly will be the last Fed speaker this Friday at 18:00 GMT, participating in a moderated conversation and Q&A session at an event hosted by Stanford University's Hoover Institution.
- Equities are struggling this Friday, looking for direction with very small gains or losses for most major European indices. US futures are trading flat.
- The CME FedWatch Tool is pricing in another 25 basis points (bps) rate cut by the Fed at the December 18 meeting by 70.1%. A 29.9% chance is for rates to remain unchanged. The Fed Minutes and recent comments from several Fed officials have helped the rate cut odds for December to move higher.
- The US 10-year benchmark rate trades at 4.18%, on the downside in this week’s range between 4.16% and 4.28%.
Economic Indicator
Nonfarm Payrolls
The Nonfarm Payrolls release presents the number of new jobs created in the US during the previous month in all non-agricultural businesses; it is released by the US Bureau of Labor Statistics (BLS). The monthly changes in payrolls can be extremely volatile. The number is also subject to strong reviews, which can also trigger volatility in the Forex board. Generally speaking, a high reading is seen as bullish for the US Dollar (USD), while a low reading is seen as bearish, although previous months' reviews and the Unemployment Rate are as relevant as the headline figure. The market's reaction, therefore, depends on how the market assesses all the data contained in the BLS report as a whole.
Read more.Next release: Fri Dec 06, 2024 13:30
Frequency: Monthly
Consensus: 200K
Previous: 12K
Source: US Bureau of Labor Statistics
America’s monthly jobs report is considered the most important economic indicator for forex traders. Released on the first Friday following the reported month, the change in the number of positions is closely correlated with the overall performance of the economy and is monitored by policymakers. Full employment is one of the Federal Reserve’s mandates and it considers developments in the labor market when setting its policies, thus impacting currencies. Despite several leading indicators shaping estimates, Nonfarm Payrolls tend to surprise markets and trigger substantial volatility. Actual figures beating the consensus tend to be USD bullish.
US Dollar Index Technical Analysis: It was never going to be a straight line
The US Dollar Index (DXY) is back to where it was roughly one month ago after retreating since it tried to topple the 108.00 level. The risk with the Nonfarm Payrolls print is that, if the number is far below estimates, the DXY could fall back all the way to pre-election levels at 104.25.
On the upside, 106.52 (April 16 high) is apparently a hard nut to crack as a first resistance after failing to close above it this week after several attempts. Should the US Dollar bulls reclaim that level, 107.00 (round level) and 107.35 (October 3, 2023, high) are back on target for a retest.
Looking down, the pivotal level at 105.53 (April 11 high) comes into play before heading into the 104-region. Should the DXY fall all the way towards 104.00, the big figure and the 200-day Simple Moving Average at 104.03 should catch any falling knife formation.
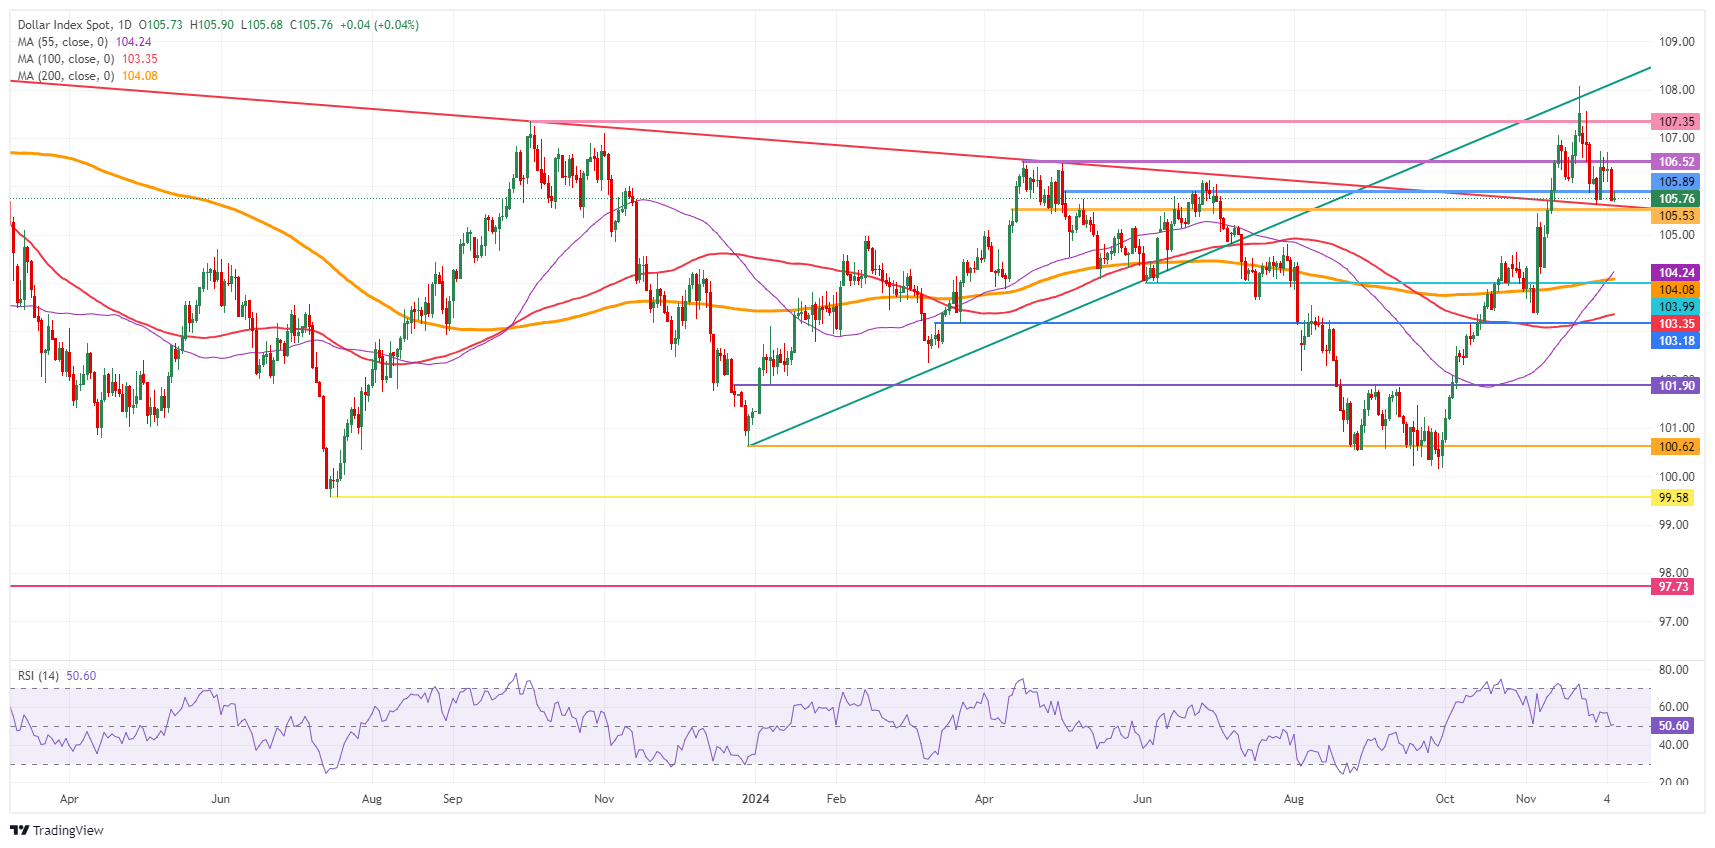
US Dollar Index: Daily Chart
US Dollar FAQs
The US Dollar (USD) is the official currency of the United States of America, and the ‘de facto’ currency of a significant number of other countries where it is found in circulation alongside local notes. It is the most heavily traded currency in the world, accounting for over 88% of all global foreign exchange turnover, or an average of $6.6 trillion in transactions per day, according to data from the Bank for International Settlements. Following the Second World War, the USD took over from the British Pound as the world’s reserve currency. For most of its history, the US Dollar was backed by Gold until the Bretton Woods Agreement in 1971, when the Gold Standard went away.
Recommended Articles


