


US Dollar extends three-day winning streak on increased safe-haven flows, lower odds of big Fed rate cut
- The US Dollar rallies for a fourth straight day this week.
- Tensions in the Middle East together with political comments in Japan are firing up Dollar inflows.
- The US Dollar Index tests the upper band of its September range and could pop above it if current conditions hold.
The US Dollar (USD) trades firmly stronger again on Thursday, fuelled by safe-haven flows due to increased geopolitical tensions in the Middle East, a weaker Japanese Yen (JPY), and diminishing chances of another large interest-rate cut by the US Federal Reserve (Fed) in November.
The US Dollar already received a nudge higher this Thursday in Asian trading after new prime minister Shigeru Ishiba said on Wednesday that the economy isn’t ready for another interest-rate increase, sending the JPY lower. The turmoil in Lebanon is also underpinning the Greenback with safe-haven inflows.
The economic calendar is ready for another very full day. Besides the weekly Jobless Claims, markets brace for the S&P Global Services Purchasing Managers index and the Institute for Supply Management (ISM) September numbers.
Daily digest market movers: Outside help for the US Dollar
- New Japanese prime minister Shigeru Ishiba said on Wednesday the economy isn’t ready for another interest-rate increase, sending the yen lower, Bloomberg reported. Bank of Japan (BoJ) board member Asahi Noguchi was quick to comment that markets should not respond to each comment politicians make.
- There were surprising comments as well from Bank of England (BoE) Governor Andrew Bailey, who said to the Guardian newspaper that the BoE might need to start cutting soon and aggressively, Bloomberg reports.
- The US economic calendar started early with the Challenger Job Cuts data for September. Around 72,821 jobs were cut against the 75,891 layoffs in August .
- At 12:30 GMT, the weekly Jobless Claims are due, with Initial Claims set to marginally rise to 220,000 from 218,000.
- Around 13:45 GMT, the final S&P Global Services Purchasing Managers Index (PMI) for September is expected to remain unchanged from its preliminary reading of 55.4. The Composite PMI should also remain steady at 54.4.
- The Institute for Supply Management (ISM) will release its September numbers for the Services sector at 14:00 GMT:
- The headline PMI should come in a little bit higher at 51.7 against 51.5 a month earlier.
- As for the main subindexes, Employment was at 50.2 in August, New Orders stood at 53 and Prices Paid came in at 57.3.
- At 14:40 GMT, Federal Reserve Bank of Atlanta Raphael Bostic participates in a discussion with Minneapolis Fed President Neel Kashkari as part of the Opportunity and Growth Institute's 2024 Fall Research Conference.
- European equities are falling more than US futures after French President Emannuel Macron has announced new taxes. US equity futures are down less than 0.5% with markets still at unease over the situation in Lebanon and the Middle East.
- The CME Fedwatch Tool shows a 67.4% chance of a 25 basis-point rate cut at the next Fed meeting on November 7, while 32.6% is pricing in another 50-basis-point rate cut.
- The US 10-year benchmark rate trades at 3.80%, looking to test the three-week high at 3.81%.
US Dollar Index Technical Analysis: Winning streak hitting bump
The US Dollar Index (DXY) has made a stellar recovery this week, though be it with a bit of outside help. With the DXY now hitting the upper cap at 101.90, risk could take place that a rejection takes place, with the DXY unable to break above the September range. Ideally, the DXY would be able to remain around these levels and have the Nonfarm Payrolls number as a catalyst to either push the DXY higher or send it back lower towards the lower end of this month.
The recovery has performed well and could be facing the end of the line for now. expect this September high at 101.90 to remain the first resistance level on the upside for now. Just above there, the 55-day Simple Moving Average (SMA) at 102.09 will come in. A leg higher the chart identifies 103.18 as the very final level for this week on the upside.
On the downside, 100.62 is flipping back from resistance into support in case the DXY closes above it this Tuesday. The fresh low of 2024 is at 100.16, so a test will take place before more downside takes place. Further down, and that means giving up the big 100.00 level, the July 14, 2023, low at 99.58 comes into play.
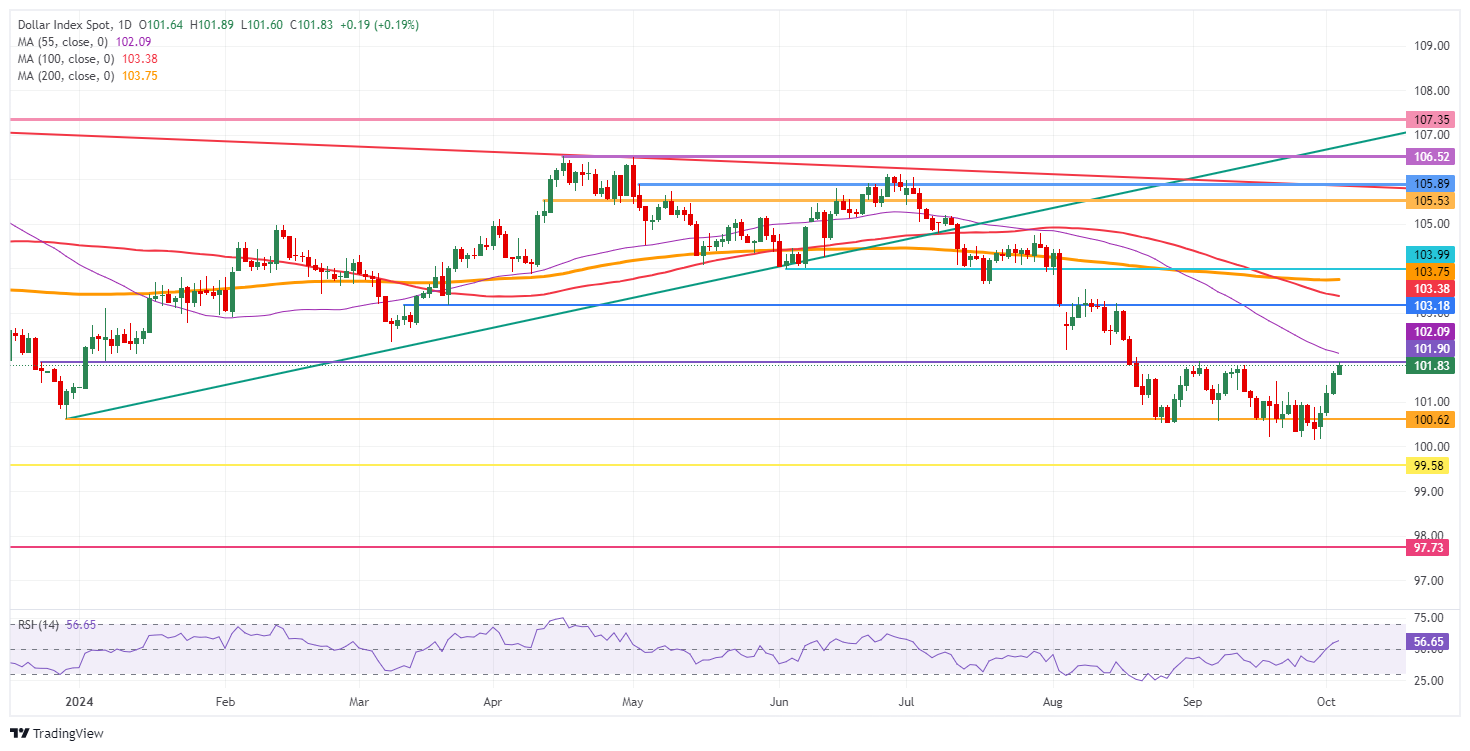
US Dollar Index: Daily Chart
US Dollar FAQs
The US Dollar (USD) is the official currency of the United States of America, and the ‘de facto’ currency of a significant number of other countries where it is found in circulation alongside local notes. It is the most heavily traded currency in the world, accounting for over 88% of all global foreign exchange turnover, or an average of $6.6 trillion in transactions per day, according to data from 2022. Following the second world war, the USD took over from the British Pound as the world’s reserve currency. For most of its history, the US Dollar was backed by Gold, until the Bretton Woods Agreement in 1971 when the Gold Standard went away.
The most important single factor impacting on the value of the US Dollar is monetary policy, which is shaped by the Federal Reserve (Fed). The Fed has two mandates: to achieve price stability (control inflation) and foster full employment. Its primary tool to achieve these two goals is by adjusting interest rates. When prices are rising too quickly and inflation is above the Fed’s 2% target, the Fed will raise rates, which helps the USD value. When inflation falls below 2% or the Unemployment Rate is too high, the Fed may lower interest rates, which weighs on the Greenback.
In extreme situations, the Federal Reserve can also print more Dollars and enact quantitative easing (QE). QE is the process by which the Fed substantially increases the flow of credit in a stuck financial system. It is a non-standard policy measure used when credit has dried up because banks will not lend to each other (out of the fear of counterparty default). It is a last resort when simply lowering interest rates is unlikely to achieve the necessary result. It was the Fed’s weapon of choice to combat the credit crunch that occurred during the Great Financial Crisis in 2008. It involves the Fed printing more Dollars and using them to buy US government bonds predominantly from financial institutions. QE usually leads to a weaker US Dollar.
Quantitative tightening (QT) is the reverse process whereby the Federal Reserve stops buying bonds from financial institutions and does not reinvest the principal from the bonds it holds maturing in new purchases. It is usually positive for the US Dollar.
Recommended Articles


