

Dow Jones Industrial Average breaches all-time highs on tepid Monday
- Dow Jones taps a new record high despite thin volumes.
- Moves in equities remain limited as investors recover from Fed splurge.
- Key US inflation data looms large at the end of the week.
The Dow Jones Industrial Average (DJIA) slipped higher to test a new record high of 41,419.65 on Monday, but investors are still recovering from last Friday’s surge after the Federal Reserve (Fed) all but confirmed that a new rate-cutting cycle would kick off in September.
US Durable Goods Orders helped to keep physical production stocks bid on Monday despite a general decline in the usual darling tech sector. US Durable Goods Order in July rallied a surprising 9.9% MoM, well above the forecast 4.0% and entirely reversing the previous month’s revised -6.9% contraction.
Despite the upswing on Durable Goods Orders, some trepidation remains; excluding Transportation spending, Durable Goods Orders actually contracted -0.2% MoM, worse than the forecast 0.0% and the previous month’s tepid 0.1%, which was revised down from 0.5%.
Most of the trading week will be a quiet affair on the economic calendar. Q2 US Gross Domestic Product (GDP) figures are slated for Thursday, but are broadly expected to hold steady at 2.8% on an annualized basis. Friday could be a kicker for markets that are increasingly focused on the timing and pace of rate cuts from the Fed, with July’s US core Personal Consumption Expenditure - Price Index (PCE) inflation print set to hold steady at 0.2% MoM. The YoY PCE inflation figure is actually expected to tick upwards to 2.7% from 2.6%, but investors are confident that inflation has made enough progress towards the Fed’s 2% target that it will count as “close enough” to still keep the way open to a first rate cut on September 18.
Dow Jones news
Caterpillar (CAT) is moving higher on Monday in sharp contrast to the wider market. The NASDAQ and S&P 500 sold off on Monday morning, while Caterpillar and a number of other Dow Jones index stocks gained ground. The Dow, in fact, reached yet another all-time high at 41,420 on Monday, following last week's decent Dow performance.
Read more: Caterpillar helps Dow Jones buck tide at start of eventful week
Dow Jones price forecast
Intraday price action sees some churn on an overall quiet Monday. Bids managed to clip into a fresh all-time high above 41,400.00 to kick off the new trading week, but the overall day is still tilted toward the low side as bulls try to run on empty.
The Dow Jones has chalked in an impressive 7.9% win streak since the first week of August, climbing from a swing low to 38,382.90 to etch in a fresh all-time high at 41,419.65. Despite the impressive run that tilted entirely into the bullish side, momentum is set to drain out of the index quickly as bidders run out of runway. The Dow Jones is poised for a relief pullback towards the 50-day Exponential Moving Average (EMA) at 39,946.29.
Dow Jones daily chart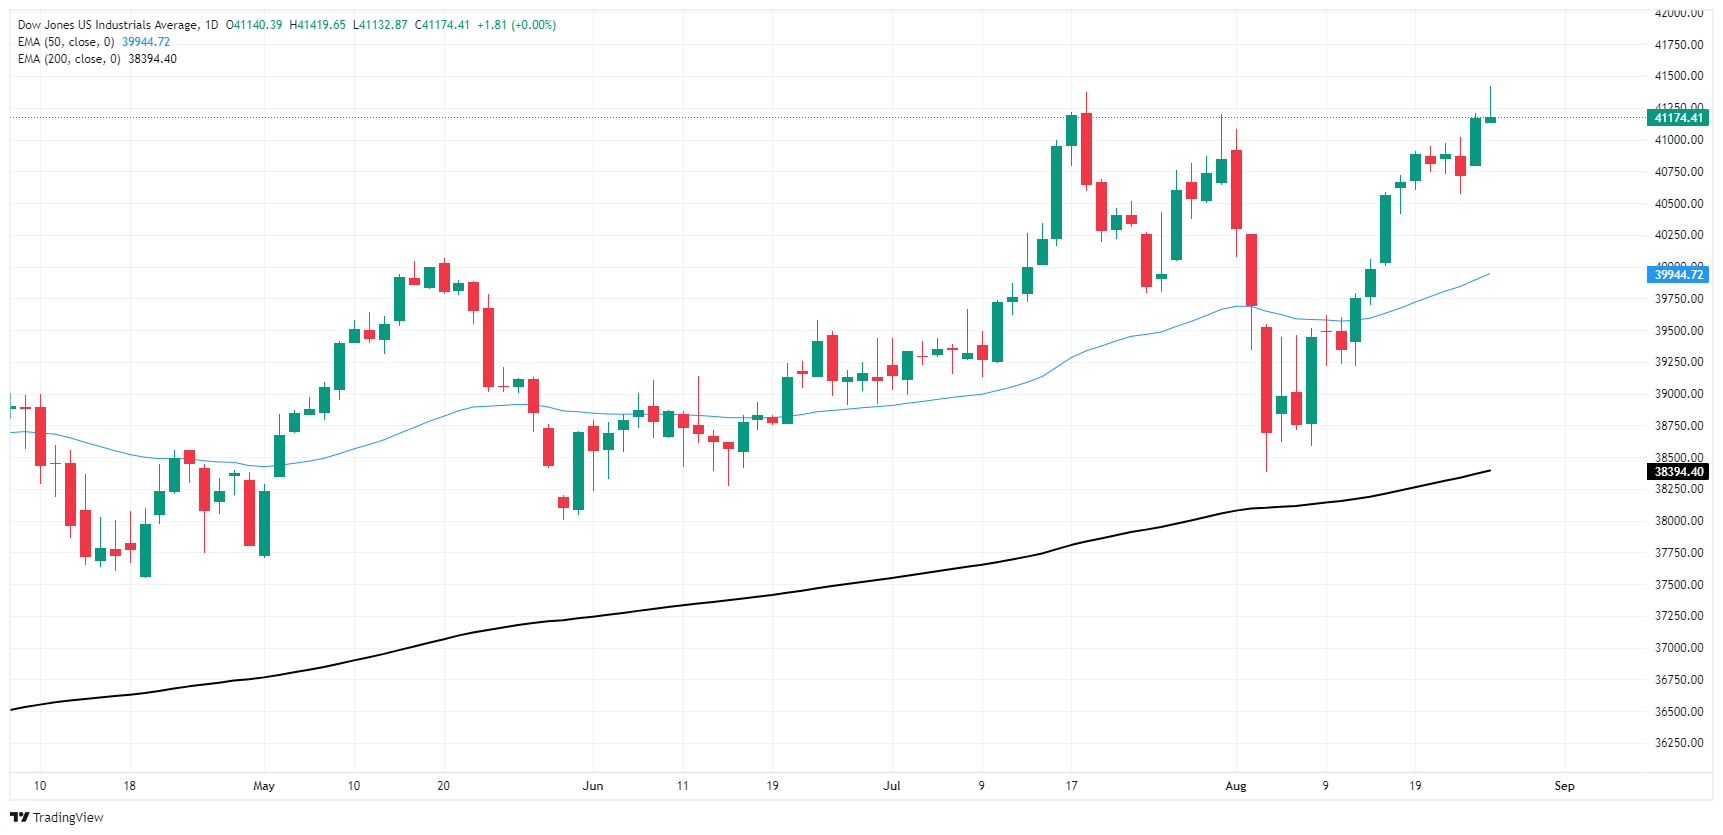
Dow Jones FAQs
The Dow Jones Industrial Average, one of the oldest stock market indices in the world, is compiled of the 30 most traded stocks in the US. The index is price-weighted rather than weighted by capitalization. It is calculated by summing the prices of the constituent stocks and dividing them by a factor, currently 0.152. The index was founded by Charles Dow, who also founded the Wall Street Journal. In later years it has been criticized for not being broadly representative enough because it only tracks 30 conglomerates, unlike broader indices such as the S&P 500.
Many different factors drive the Dow Jones Industrial Average (DJIA). The aggregate performance of the component companies revealed in quarterly company earnings reports is the main one. US and global macroeconomic data also contributes as it impacts on investor sentiment. The level of interest rates, set by the Federal Reserve (Fed), also influences the DJIA as it affects the cost of credit, on which many corporations are heavily reliant. Therefore, inflation can be a major driver as well as other metrics which impact the Fed decisions.
Dow Theory is a method for identifying the primary trend of the stock market developed by Charles Dow. A key step is to compare the direction of the Dow Jones Industrial Average (DJIA) and the Dow Jones Transportation Average (DJTA) and only follow trends where both are moving in the same direction. Volume is a confirmatory criteria. The theory uses elements of peak and trough analysis. Dow’s theory posits three trend phases: accumulation, when smart money starts buying or selling; public participation, when the wider public joins in; and distribution, when the smart money exits.
There are a number of ways to trade the DJIA. One is to use ETFs which allow investors to trade the DJIA as a single security, rather than having to buy shares in all 30 constituent companies. A leading example is the SPDR Dow Jones Industrial Average ETF (DIA). DJIA futures contracts enable traders to speculate on the future value of the index and Options provide the right, but not the obligation, to buy or sell the index at a predetermined price in the future. Mutual funds enable investors to buy a share of a diversified portfolio of DJIA stocks thus providing exposure to the overall index.
Recommended Articles


