

Dow Jones Industrial Average advances with geopolitical concerns weighing risk appetite
- Dow Jones index ticks up after upbeat US Retail Sales with Middle East tensions limiting gains.
- Goldman Sachs is leading gains, following better-than-expected quarterly results.
- The technical picture remains bearish with DJIA drifting away from March high.
The Dow Jones Industrial Average (DJIA) has opened the week with mild gains, retracing some ground following last Friday’s sell-off. Investors, however, are taking a cautious stance wary that the Middle East conflict might escalate into a regional war involving Iran.
Traders are holding their breath as Israel considers its options to retaliate against Iran, with right-wing ministers calling for an immediate response.
Retail Sales data from the US has beaten expectations, confirming the strong momentum of the US economy. This is positive for market sentiment, although its consequences for monetary policy push back on hopes of interest rate cuts by the Federal Reserve (Fed), creating negative pressure on stocks.
All in all, Wall Street is trading higher. The Dow Jones leads gains, 0.31% higher, to 38,097. The S&P 500 trades up 0.21% at 5,134, and the NASDAQ is practically flat at 16,175 during the US morning session.
Dow Jones news
Most of the Wall Street sectors are posting gains on Monday as the Health sector leads with a 0.8% advance. That sector is followed by the Financials, up 0.6%, and Materials, gaining 0.5%. Only Real Estate and Utilities are losing value, down 0.93% and 0.23%, respectively.
Goldman Sachs (GS) is leading gains on Monday with a 3.7% rally to $403.85, fuelled by better-than-expected quarterly results. Next is Intel (INTC), which rises 2.6% to $36.44. On the losing end, Salesforce (CRM) drops 5.4% as news reports suggest that the software firm is in talks to acquire Informatica.
Dow Jones technical outlook
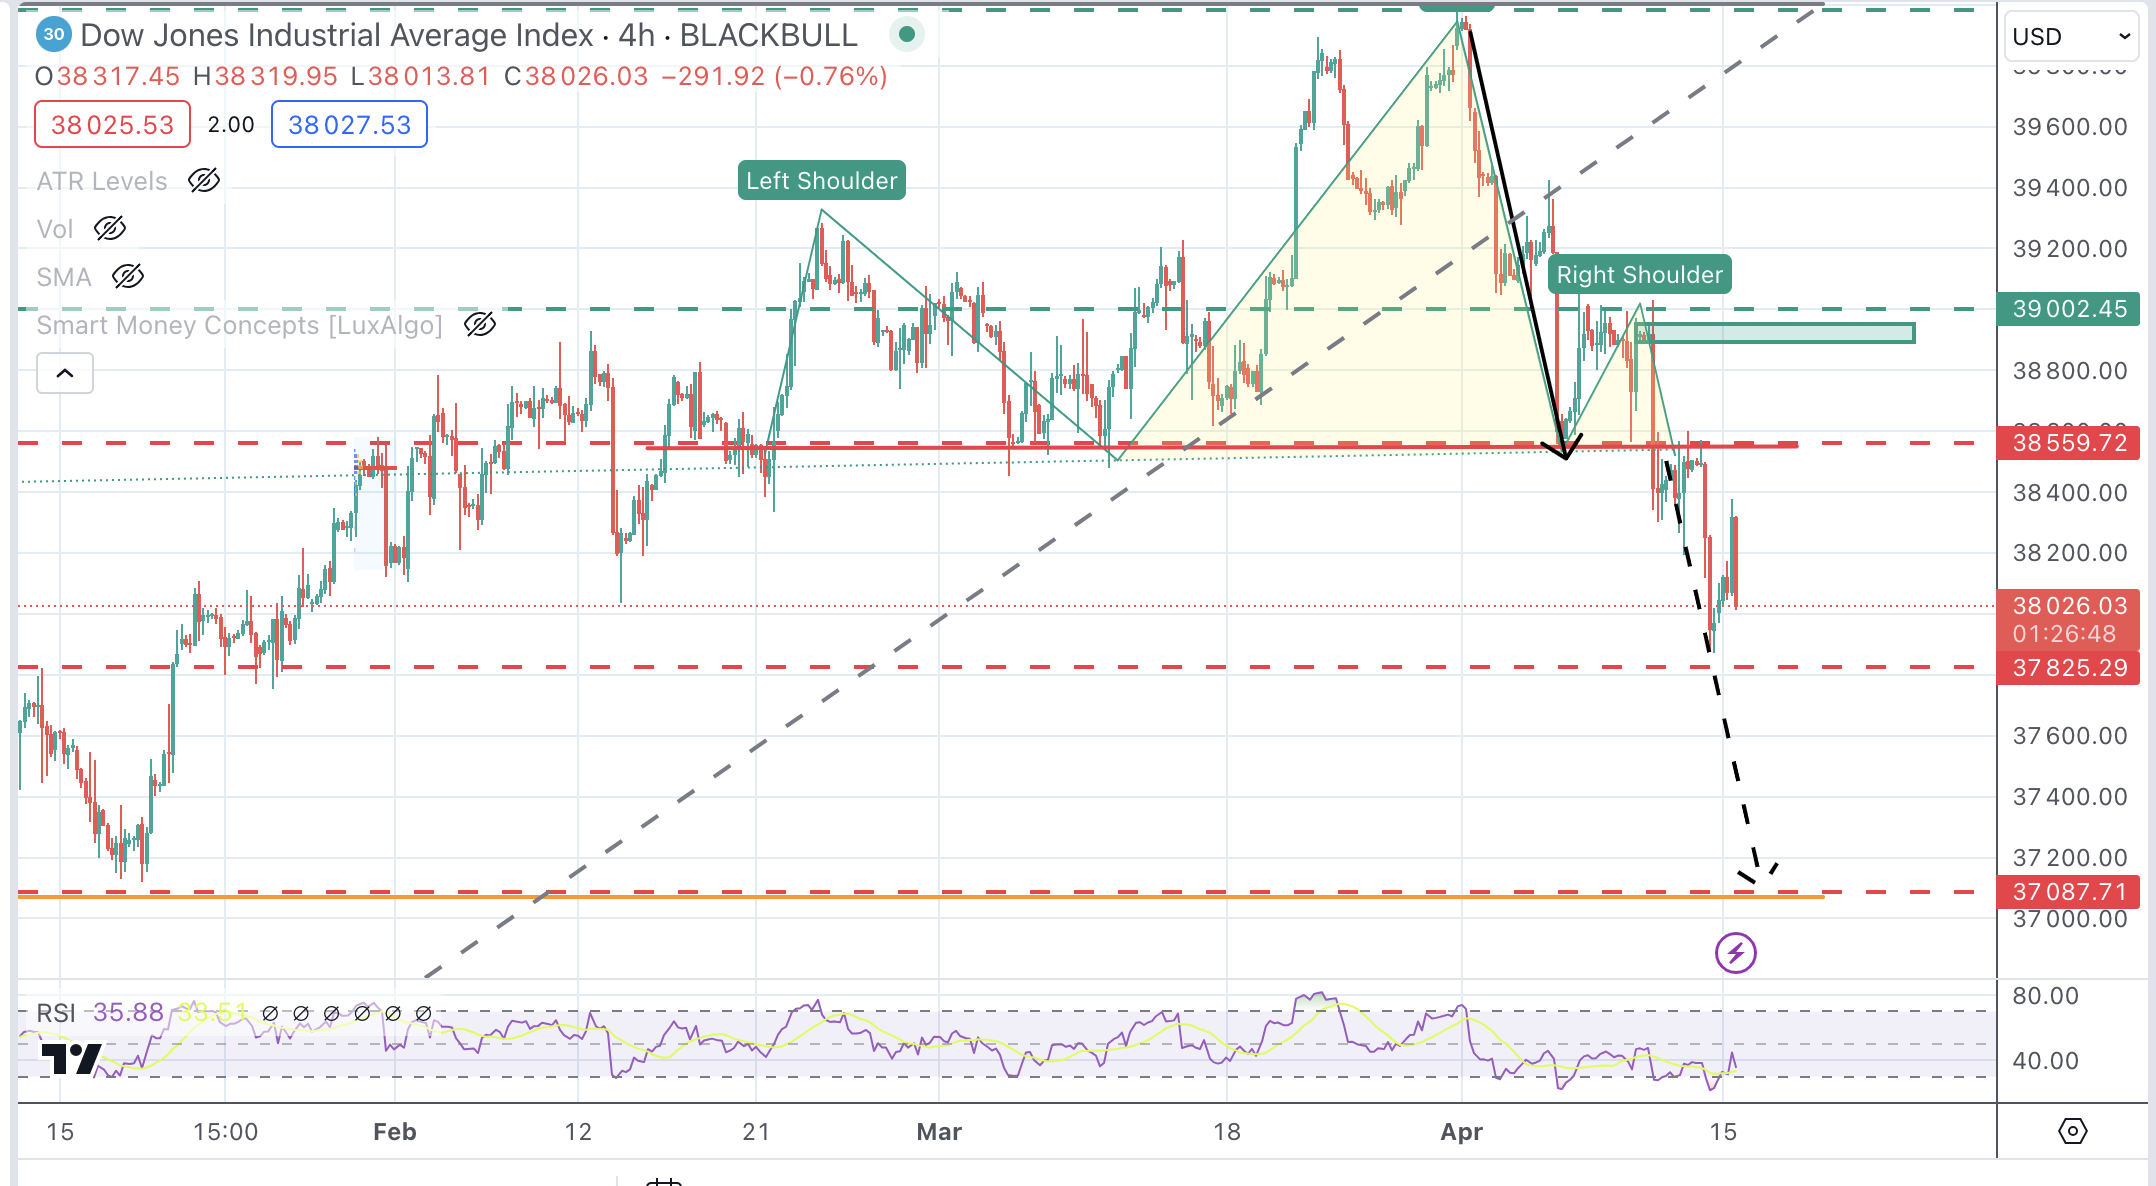
The technical picture shows the bears in control as the Dow Jones index drifts away from the historic highs reached in March. The move below 38,560 has activated a bearish Head & Shoulders pattern that might hint toward a sharper decline.
The next bearish target is 37,825. Below here the measured target of the H&S pattern, which meets the mid-January low and 38.6% Fibonacci retracement, comes at 37,087. A bullish reaction should overcome the 38,540 to open the path toward 39,000 (order block).
Dow Jones Index 4 -Hour Chart
S&P 500 FAQs
The S&P 500 is a widely followed stock price index which measures the performance of 500 publicly owned companies, and is seen as a broad measure of the US stock market. Each company’s influence on the computation of the index is weighted based on market capitalization. This is calculated by multiplying the number of publicly traded shares of the company by the share price. The S&P 500 index has achieved impressive returns – $1.00 invested in 1970 would have yielded a return of almost $192.00 in 2022. The average annual return since its inception in 1957 has been 11.9%.
Companies are selected by committee, unlike some other indexes where they are included based on set rules. Still, they must meet certain eligibility criteria, the most important of which is market capitalization, which must be greater than or equal to $12.7 billion. Other criteria include liquidity, domicile, public float, sector, financial viability, length of time publicly traded, and representation of the industries in the economy of the United States. The nine largest companies in the index account for 27.8% of the market capitalization of the index.
There are a number of ways to trade the S&P 500. Most retail brokers and spread betting platforms allow traders to use Contracts for Difference (CFD) to place bets on the direction of the price. In addition, that can buy into Index, Mutual and Exchange Traded Funds (ETF) that track the price of the S&P 500. The most liquid of the ETFs is State Street Corporation’s SPY. The Chicago Mercantile Exchange (CME) offers futures contracts in the index and the Chicago Board of Options (CMOE) offers options as well as ETFs, inverse ETFs and leveraged ETFs.
Many different factors drive the S&P 500 but mainly it is the aggregate performance of the component companies revealed in their quarterly and annual company earnings reports. US and global macroeconomic data also contributes as it impacts on investor sentiment, which if positive drives gains. The level of interest rates, set by the Federal Reserve (Fed), also influences the S&P 500 as it affects the cost of credit, on which many corporations are heavily reliant. Therefore, inflation can be a major driver as well as other metrics which impact the Fed decisions.
Recommended Articles


