

Bitcoin Could See A Weekend Rally To $100,000 – Is BTC Ready For New Highs?

Source Newsbtc

As Bitcoin (BTC) attempts to break out from its weekly range, its price eyes the crucial $99,000-$100,000 resistance barrier, fueling bullish sentiment among investors. Multiple analysts forecast that the flagship’s crypto next all-time high (ATH) rally is around the corner, with some suggesting that the initial jump could come in the coming days.

Bitcoin To $100,000 This Weekend?

Over the past two weeks, Bitcoin has recovered from its sub-$80,000 correction, breaking above the $90,000 mark and reclaiming the $93,5000 resistance to re-enter its post-US elections price range.

Amid its recovery, the cryptocurrency consolidated between the $93,000-$96,000 range, moving sideways for the last weeks. The start-of-month pump has seen BTC break out of this range after being compressed during this period, resembling its performance from two weeks ago.

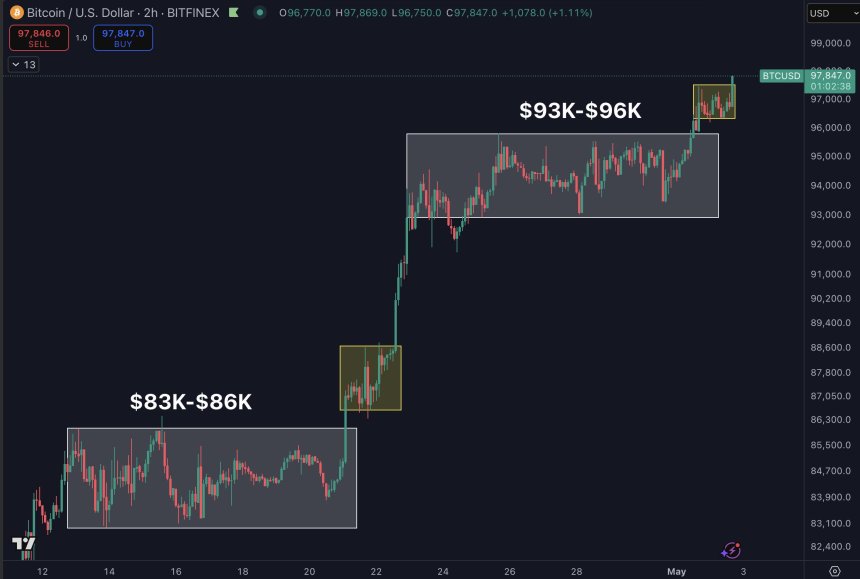
Analyst Daan Crypto Trades explained that BTC surged to the $83,000-$86,000 region during the mid-April recovery, consolidating for over a week before a small 2% breakout toward the $87,500 resistance. This was followed by a two-day “tight chop” and a breakout to a new higher range.
bitcoin

He suggested that Bitcoin displays “a similar setup as the week before” as it has ranged and compressed within the $93,000-$96,000 zone and jumped around 2% to the $97,700 mark.

Additionally, the largest crypto by market capitalization’s “tight chop” phase could have started as its price has hovered between $97,050 and $97,700 for the past few hours.

If BTC replicates its recent performance, the flagship crypto could rally around 8% toward a new range at the end of the weekend and retest $99,000-$100,000 in the coming days.

BTC Resembles Q4 2024 Price Action

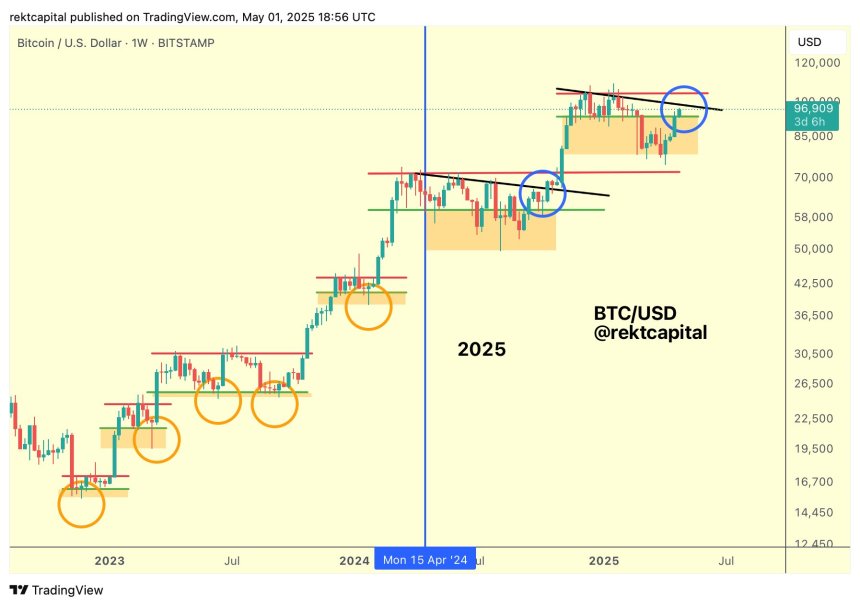
Meanwhile, analyst Rekt Capital suggested that Bitcoin could repeat its Q4 2024 performance. He highlighted that BTC has recovered from its downside deviation to reclaim its recent re-accumulation range, but it’s facing a lower high resistance within this zone.

Notably, the cryptocurrency experienced the same situation in the post-halving re-accumulation range, initially rejected from the lower high to fall to the range’s lows. Weeks later, Bitcoin broke above the lower high resistance, restesting it as support before breaking out and soaring to a new ATH.

The analyst noted that the idea was first explored before the US election pump, suggesting that BTC could mimic its Q1 2024 rally, fueled by the US spot Bitcoin Exchange-Traded Funds (ETFs).
bitcoin

“It would be poetry if Bitcoin repeated history and followed through on the same path in this current Range as well,” he stated.

However, Rekt Capital detailed that for history to repeat, Bitcoin must get rejected at $99,000, hold the $93,500 mark as support, and break the $97,000-$99,000 range before being rejected at the $104,500 resistance.

Then the flagship crypto would need to hold the $97,000-$99,000 range as support for a similar breakout to new ATHs.

The analyst concluded that if Bitcoin continues holding the $93,500 mark, the price will be positioned to move across its re-accumulation range. Nonetheless, BTC must break its “black Lower High resistance within this Range, which is positioned at ~$99k this week.”

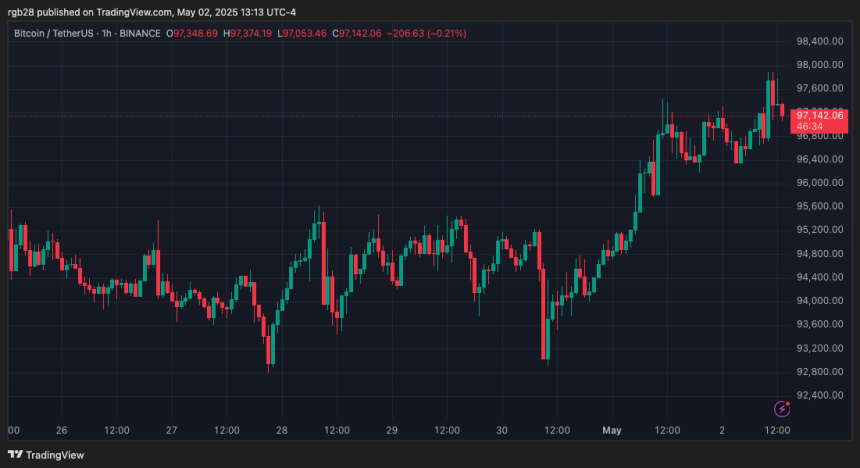
As of this writing, Bitcoin trades at $97,461, a 3% increase in the weekly timeframe.
Bitcoin, btc, btcusdt
Disclaimer: For information purposes only. Past performance is not indicative of future results.
placeholder
Gold Faces Pressure Ahead of Fed Decision as Prices Extend Drop Below $4,000 As of the Asian session on October 23, gold prices (XAUUSD) continued Thursday's decline, dipping below the $4,000 mark during intraday trading to hit a low of $3,986.54. On Thursday, gol
Author  TradingKey
11 hours ago
As of the Asian session on October 23, gold prices (XAUUSD) continued Thursday's decline, dipping below the $4,000 mark during intraday trading to hit a low of $3,986.54. On Thursday, gol
placeholder
Nasdaq closes at 26,008.86 — 8.9 points above 26,000, and the credit market never blinkedThe Nasdaq Composite fell 2.60% to 26,008.86 on October 22, its worst session since June, as Meta sank 6.98% on 2026 capex guidance of $135–145 billion. But the equal-weight S&P 500 rose 0.73%, high-yield credit was flat and 10-year yields fell 20 basis points. This was an AI de-rating, not a risk-off event — here is the transmission chain, the 29,000 / 28,200 levels and what would prove it wrong.
Author  Irene Q.
12 hours ago
The Nasdaq Composite fell 2.60% to 26,008.86 on October 22, its worst session since June, as Meta sank 6.98% on 2026 capex guidance of $135–145 billion. But the equal-weight S&P 500 rose 0.73%, high-yield credit was flat and 10-year yields fell 20 basis points. This was an AI de-rating, not a risk-off event — here is the transmission chain, the 29,000 / 28,200 levels and what would prove it wrong.
placeholder
Brent tops $113 on Saudi supply risk — but the diesel line in the EIA report is the tellBrent's December contract settled at $113.17 on October 22, up 4.00% and the highest close since May 4, after Saudi Arabia restricted refined-product shipments. The same session's EIA report showed crude stocks down 3.06 million barrels and gasoline down 2.95 million — but distillates built 1.68 million. That single line decides whether $113 holds: here are the data, the 108.8 / 114.0 / 119.3 levels and the two scenarios.
Author  Irene Q.
13 hours ago
Brent's December contract settled at $113.17 on October 22, up 4.00% and the highest close since May 4, after Saudi Arabia restricted refined-product shipments. The same session's EIA report showed crude stocks down 3.06 million barrels and gasoline down 2.95 million — but distillates built 1.68 million. That single line decides whether $113 holds: here are the data, the 108.8 / 114.0 / 119.3 levels and the two scenarios.
placeholder
Gold Price Analysis Today | Forex Gold Analysis | XAU/USD Analysis - October 23, 2026Get the latest gold price analysis, forex gold insights, and XAU/USD analysis for October 23, 2026. Read on for the details.
Author  Mitrade
16 hours ago
Get the latest gold price analysis, forex gold insights, and XAU/USD analysis for October 23, 2026. Read on for the details.
placeholder
Gold falls to two‑month low below $4,050 as oil spikesGold price (XAU/USD) falls to the lowest in more than two months near $4,025 during the early Asian session on Friday. The precious metal faces some selling pressure as escalating tensions in the Middle East send oil surging ahead of a Federal Reserve (Fed) policy meeting.
Author  FXStreet
17 hours ago
Gold price (XAU/USD) falls to the lowest in more than two months near $4,025 during the early Asian session on Friday. The precious metal faces some selling pressure as escalating tensions in the Middle East send oil surging ahead of a Federal Reserve (Fed) policy meeting.
goTop
quote