


SingularityNET Price Prediction: 15% drop likely for AGIX as multiple on-chain metrics flash bearish
- SingularityNET price has dropped almost 12% since rejection from the peak of the market range at the $0.6000 psychological level.
- AGIX could extend the fall nearly 15% before providing a buying opportunity for late and sidelined investors.
- A higher high above $0.5999 would invalidate the bearish thesis.
SingularityNET (AGIX) price has lost some of the ground covered over the past week, a profit-booking exercise that is accentuated by the pullback or correction implications of an overbought asset.
Also Read: Crypto AI tokens outperform several altcoins with price rally: TAO, AKT, PRIME, AGIX
AGIX could fall 15% as AI narrative fades
SingularityNET (AGIX) price rallied tenfold over the past week, steered by the AI narrative. As the theme fades, however, investors are cashing in for quick profits. Consequently, AGIX price is down almost 15% since the intraday high of $0.5999 on Wednesday.
Technical indicators suggest that the odds are steadily leaning in favor of the bears. The Relative Strength Index (RSI) is on a steep nosedive, showing momentum is falling fast. Its position above 70 suggests AGIX is overbought, and once the momentum indicator crosses below 70, the AI token would be ripe for selling.
The histogram bars of the Moving Average Convergence Divergence (MACD) are also fading, which is evidence of the bulls losing their grip on AGIX.
If the bears have their way, SingularityNET price could lose support due to the 78.6% Fibonacci at $0.5061. This could open the drains for a slip to the formidable support at $0.4563, 15% below current levels. If it fails to hold, however, AGIX price could retrace the most critical Fibonacci level, 61.8%, at $0.4314.
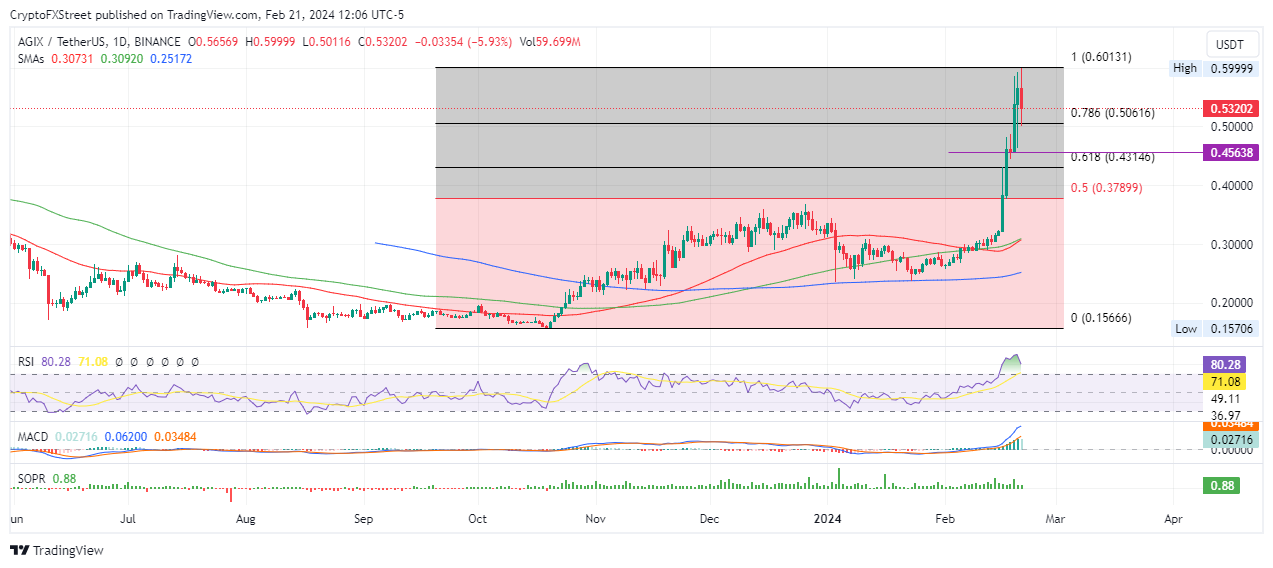
AGIX/USDT 1-day chart
On-chain metrics supporting bearish outlook for SingularityNET price
Santiment’s active deposits and deposit transaction metrics have noted spikes over the last few days, suggesting a rise in short-term selling pressure. This is because investors move their assets into exchanges whenever they plan to sell.
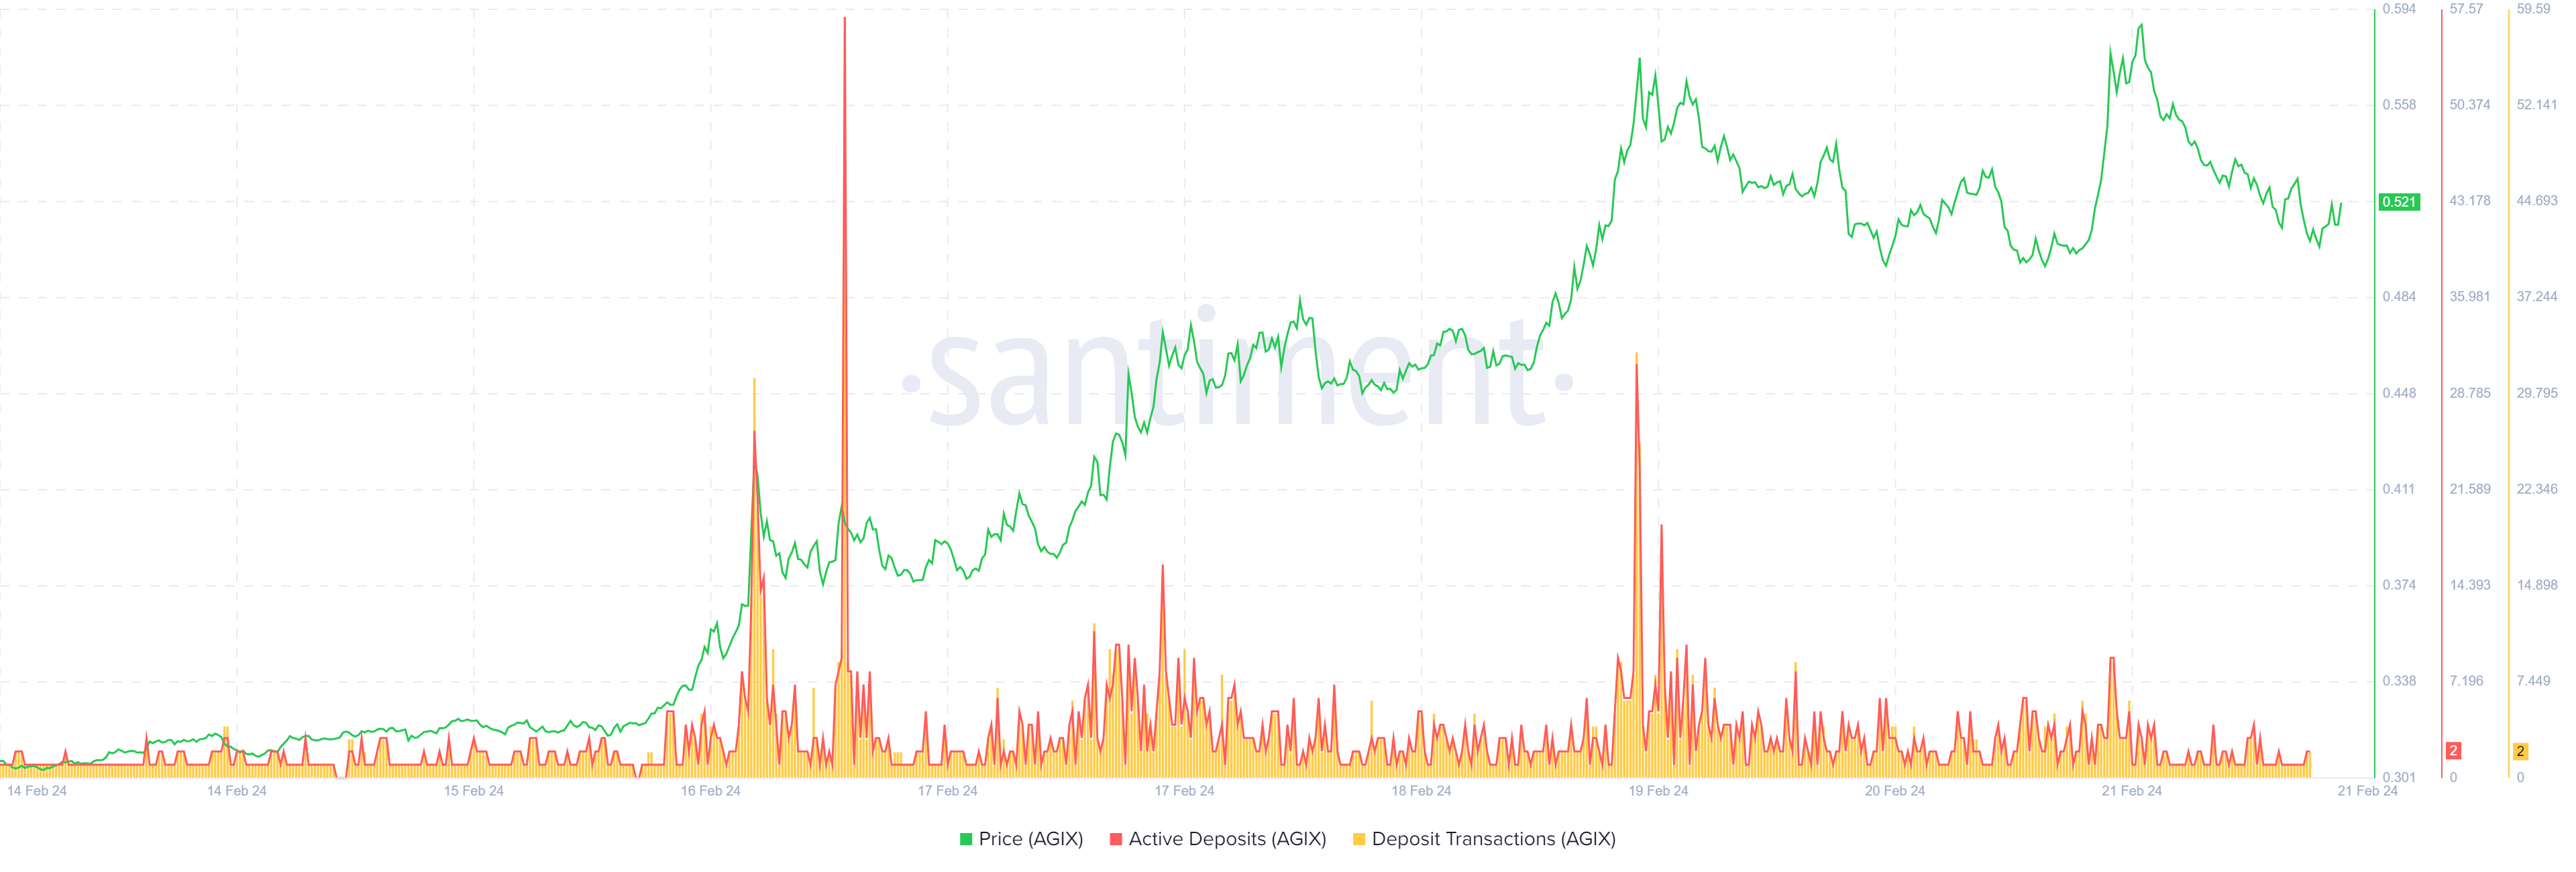
AGIX Santiment: Active deposits, Deposit transactions
Also, there is a notable drop in the daily active addresses, pointing to reduced crowd interaction with AGIX token, likely amid the fading AI narrative. Between February 19 and 21, this metric has moved from 1,997 to 688, representing a 66% drop in two days.
There is also a drop in network growth, moving from 783 to 239, while development activity remains far below the mid-February highs of 0.2640 at 0.1410. These features add credence to the bearish thesis.
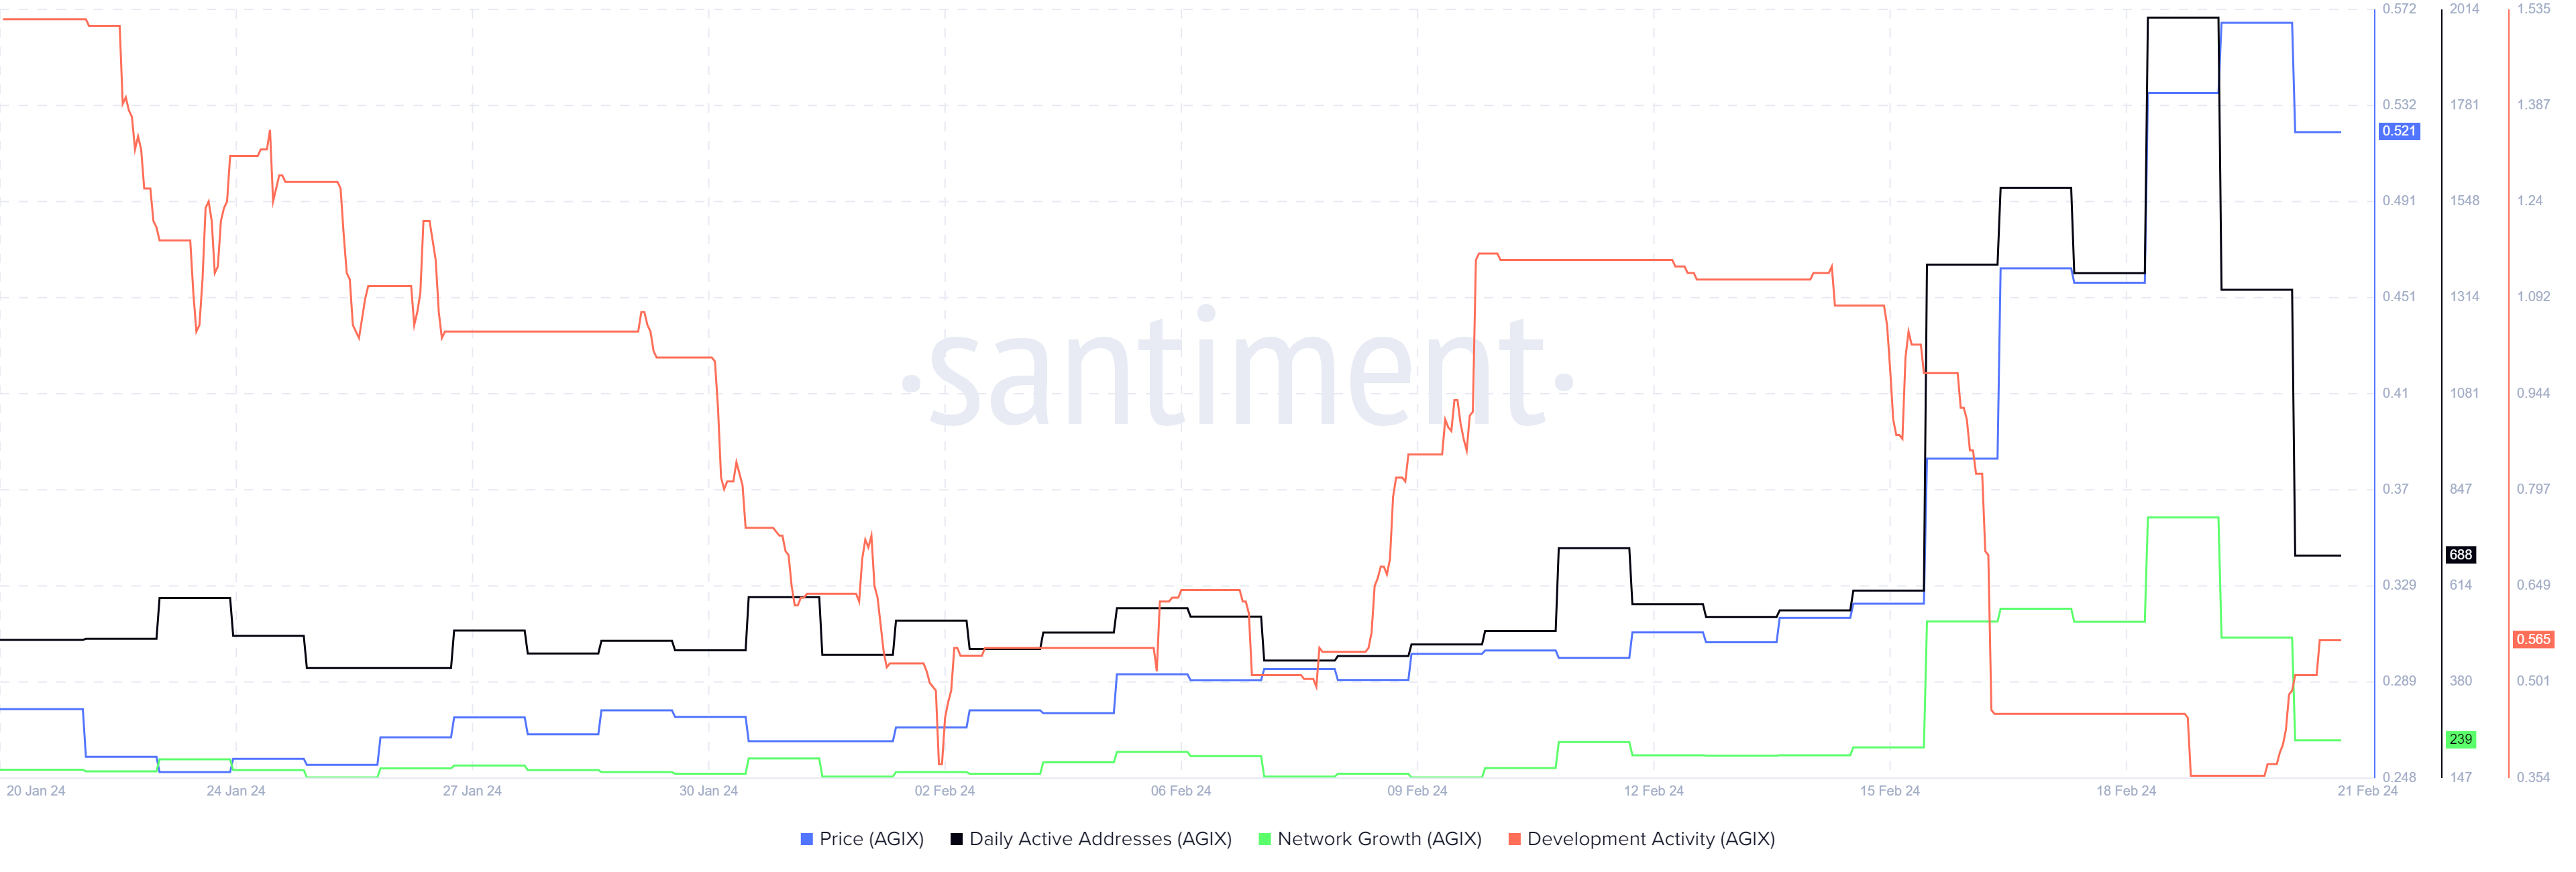
AGIX Santiment: Daily active addresses, Network growth, Development activity
However, enhanced buyer momentum above current levels could see SingularityNET price reclaim the $0.5999 range high. A break and close above this level would invalidate the bearish thesis. Beyond this supplier congestion level, AGIX price could extend a neck to the $0.7000 psychological level, almost 35% above current levels.
Cryptocurrency prices FAQs
How do new token launches or listings affect cryptocurrency prices?
Token launches like Arbitrum’s ARB airdrop and Optimism OP influence demand and adoption among market participants. Listings on crypto exchanges deepen the liquidity for an asset and add new participants to an asset’s network. This is typically bullish for a digital asset.
How do hacks affect cryptocurrency prices?
A hack is an event in which an attacker captures a large volume of the asset from a DeFi bridge or hot wallet of an exchange or any other crypto platform via exploits, bugs or other methods. The exploiter then transfers these tokens out of the exchange platforms to ultimately sell or swap the assets for other cryptocurrencies or stablecoins. Such events often involve an en masse panic triggering a sell-off in the affected assets.
How do macroeconomic releases and events affect cryptocurrency prices?
Macroeconomic events like the US Federal Reserve’s decision on interest rates influence risk assets like Bitcoin, mainly through the direct impact they have on the US Dollar. An increase in interest rate typically negatively influences Bitcoin and altcoin prices, and vice versa. If the US Dollar index declines, risk assets and associated leverage for trading gets cheaper, in turn driving crypto prices higher.
How do major crypto upgrades like halvings, hard forks affect cryptocurrency prices?
Halvings are typically considered bullish events as they slash the block reward in half for miners, constricting the supply of the asset. At consistent demand if the supply reduces, the asset’s price climbs. This has been observed in Bitcoin and Litecoin.
Recommended Articles


