

Ripple's XRP witness decline in key on-chain metrics amid funding rates reset
- XRP weekly active addresses dropped by over 180K after its recent price correction.
- XRP investors continue record profit-taking for the second consecutive week with nearly $2.2 billion in realized profits.
- Funding rates reset could spur a fresh XRP rally to new highs.
Ripple's XRP is up 4% on Friday after recovering from a sharp correction during the week. While the remittance-based token saw a drop in weekly active addresses and increased profit-taking, its recent funding rates reset could help spur a fresh rally.
XRP on-chain metrics display mixed sentiment among investors
XRP witnessed a drop-off in network activity after seeing a slight correction earlier in the week. The total number of weekly active XRP addresses declined from a yearly high of 495K to 312K on Friday. This suggests that most of XRP's recent wallet activity came from traders/investors rather than real utility growth.
 [02.38.11, 14 Dec, 2024]-638697371098764536.png)
XRP Active Addresses | Santiment
Next, XRP supply distribution reveals mixed sentiment among whales. Small-scale whales (1M to 10M XRP) continued their accumulation spree during the week, growing their balance by 180 million XRP.
However, large-scale whales (10M to 100M XRP) reduced their holdings by over 340 million XRP during the same period.
 [02.40.05, 14 Dec, 2024]-638697372253851958.png)
XRP Supply Distribution | Santiment
Despite the mixed whale activity, XRP flows across spot exchanges show that outflows outpaced inflows during the week but with reduced trading volume. Outflows in spot exchanges indicate a bullish bias among spot investors.
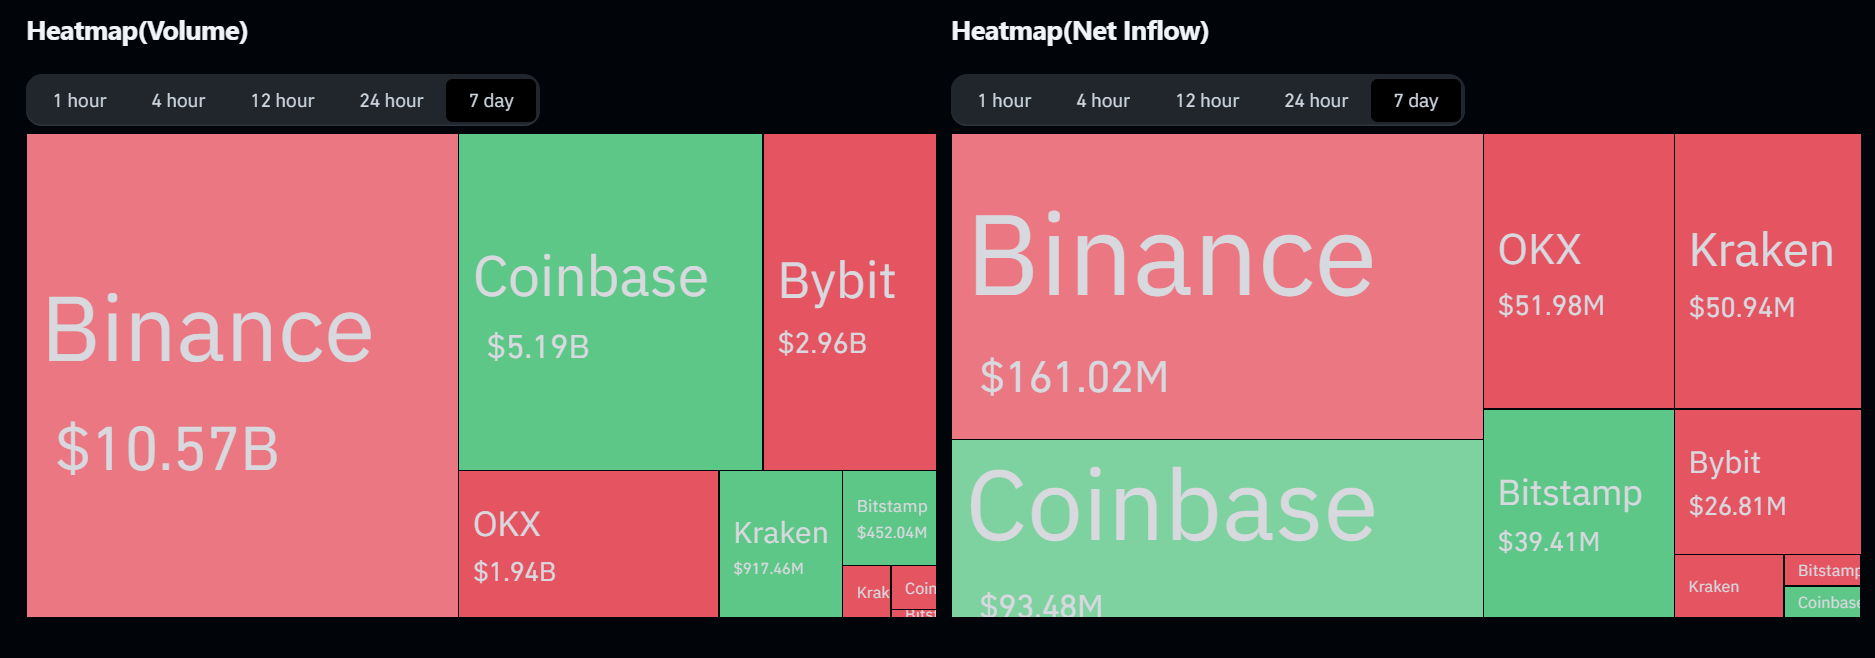
XRP Spot Data Analysis | Coinglass
Meanwhile, XRP investors realized about $2.2 billion in profits during the week. Notably, investors booked nearly $1.4 billion in profits on Wednesday after XRP recovered from a dip to $1.91. This marks the second-highest profit-taking day since 2021 after investors realized profits of $1.6 billion on December 1. This trend could continue if XRP resumes its rally and rises to key profit targets.
 [02.41.34, 14 Dec, 2024]-638697373093706170.png)
XRP Network Realized Profit/Loss | Santiment
Key XRP news during the week
- Ripple Labs received approval from the New York Department of Financial Services (NYDFS) to launch its RLUSD stablecoin in the US. RLUSD will go live on the XRP Ledger and Ethereum blockchain in the coming months, enabling users to leverage it across DeFi applications.
- In an X post on Wednesday, crypto influencer Ben Armstrong, aka Bitboy crypto, indicated that the market could see an XRP ETF in the coming months following a 300% growth in Grayscale's XRP Trust since its launch in September. The net asset value (NAV) per share of the trust has grown from $10.85 on September 5 to $48.27 on Friday.
XRP funding reset may be what's needed to help spur rally to new highs
XRP's funding rates returned to normal levels during the week, dropping from a peak of 0.096% on December 5 to 0.012% on Friday, per Coinglass data. The drop-off also came with significant liquidations in the past two weeks. With funding rates at normal levels, XRP could begin a fresh quest to new highs if the wider crypto market's bullish sentiment continues.
Meanwhile, after seeing a rejection near the upper boundary of a flag channel, XRP is on the verge of breaking above the resistance. A firm close above this upper boundary and an eventual move above the resistance level near $2.58 could spark an XRP rally to a new all-time high of $4.78.
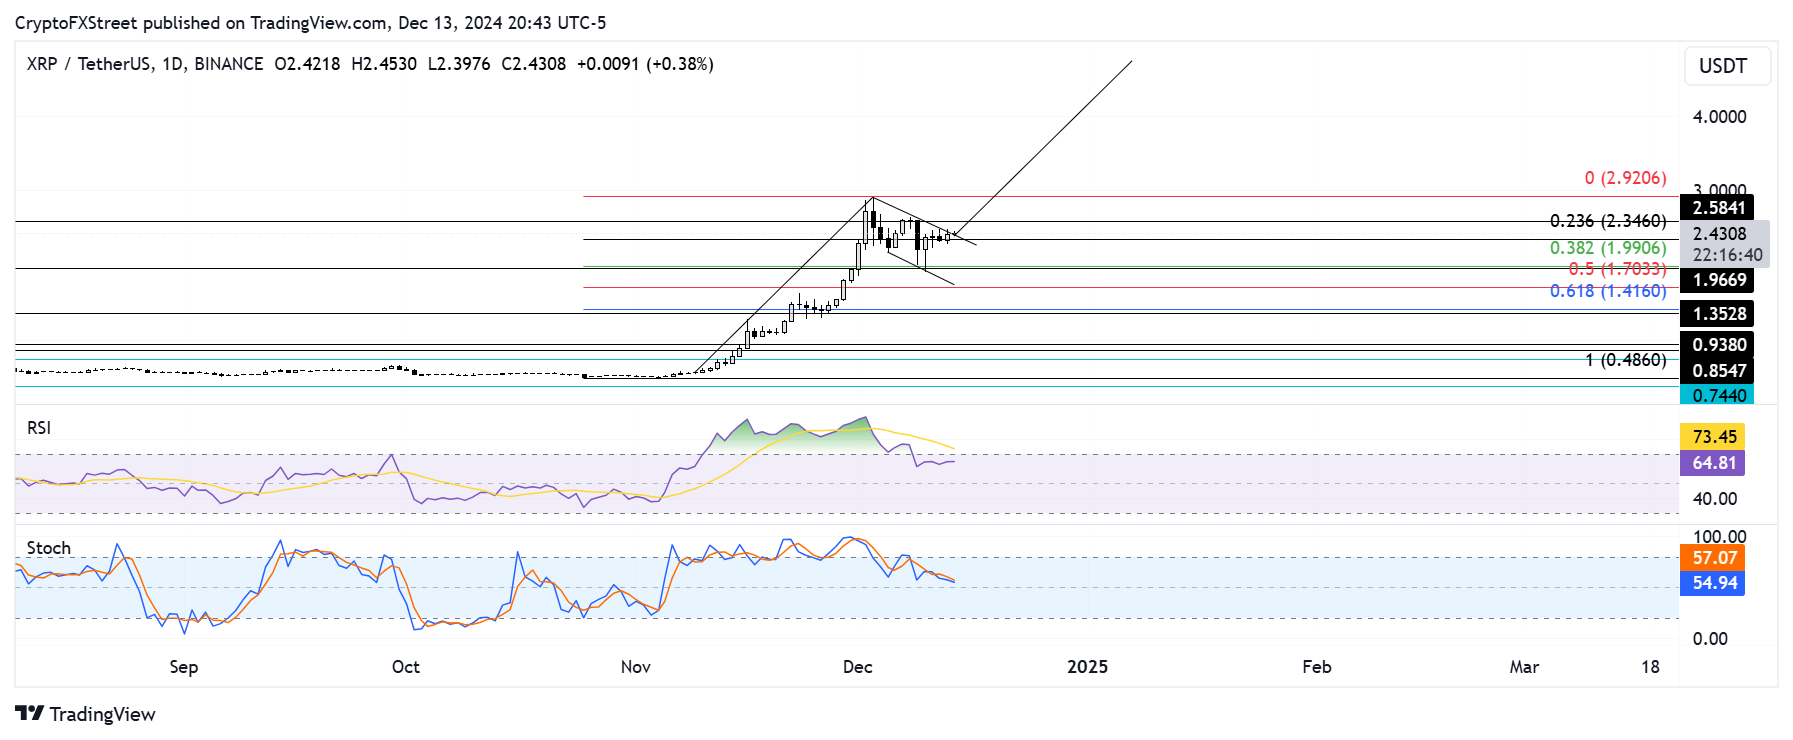
XRP/USDT daily chart
However, XRP has to overcome the selling pressure near the $3.00 psychological level to complete this move.
The Relative Strength Index (RSI) and Stochastic Oscillator are above their neutral levels, indicating dominant bullish momentum.
A daily candlestick close below $1.96 will invalidate the bullish thesis.
Ripple FAQs
Ripple is a payments company that specializes in cross-border remittance. The company does this by leveraging blockchain technology. RippleNet is a network used for payments transfer created by Ripple Labs Inc. and is open to financial institutions worldwide. The company also leverages the XRP token.
XRP is the native token of the decentralized blockchain XRPLedger. The token is used by Ripple Labs to facilitate transactions on the XRPLedger, helping financial institutions transfer value in a borderless manner. XRP therefore facilitates trustless and instant payments on the XRPLedger chain, helping financial firms save on the cost of transacting worldwide.
XRPLedger is based on a distributed ledger technology and the blockchain using XRP to power transactions. The ledger is different from other blockchains as it has a built-in inflammatory protocol that helps fight spam and distributed denial-of-service (DDOS) attacks. The XRPL is maintained by a peer-to-peer network known as the global XRP Ledger community.
XRP uses the interledger standard. This is a blockchain protocol that aids payments across different networks. For instance, XRP’s blockchain can connect the ledgers of two or more banks. This effectively removes intermediaries and the need for centralization in the system. XRP acts as the native token of the XRPLedger blockchain engineered by Jed McCaleb, Arthur Britto and David Schwartz.
Recommended Articles


