


MANTA price prediction 2024-2030: Will Manta Network survive or crash?
Key Takeaways
- MANTA price faces bullish pressure around $0.8.
- Our Manta price forecast expects Manta price to surge to a maximum level of $2.47 in 2024.
- In 2030, Manta price prediction expects Manta price to record a maximum level of $22.28.
Launched in September 2023, the Manta Network gained significant attention within the cryptocurrency community after its token generation event, leading to trending status on major coin aggregators and news outlets.
Beyond the initial buzz, Manta Network presents innovative technology through a modular zero-knowledge (ZK) rollup for Ethereum, featuring Solidity smart contracts and a decentralized identity layer one network focusing on compliance.
This article will explore the details of the Manta Network and examine potential future price movements of its native token, $MANTA, to provide a comprehensive MANTA price prediction.
Overview
| Cryptocurrency | Manta Network |
| Ticker Symbol | MANTA |
| Price | $0.88 |
| Price Change 24H | +1.5% |
| Market Cap | $419,329,788 |
| Circulating Supply | 251,000,000 MANTA |
| Trading Volume 24H | $19,307,949 |
| All Time High | $4.08 |
| All Time Low | $1.51 |
Manta Price Prediction: Technical Analysis
| Metric | Value |
| Current Price | $0.88 |
| Price Prediction | $ 2.12 (227.48%) |
| Fear & Greed Index | 29 (Fear) |
| Sentiment | Bearish |
| Volatility | 6.89% |
| Green Days | 15/30 (50%) |
| 50-Day SMA | $ 0.810178 |
| 200-Day SMA | $ 1.758745 |
| 14-Day RSI | 37.14 |
MANTA Price Analysis: Manta price faces bullish pressure toward $0.9
- MANTA price analysis shows a bullish pressure around $0.9
- Resistance for Manta is present at $0.97
- Support for MANTA/USDT is present at $0.85
Manta price analysis 1-day chart: Buyers attempt to meet bullish goals above resistance lines
Analyzing the daily price chart of the MANTA token, Manta witnessed a surge in buying pressure after bulls attempted to send the price above Fib channels. Over the last 24 hours, Manta’s price has increased, aiming for a hold above $0.9. The 24-hour volume surged to $14 million, increasing interest in trading today. Manta is trading at $0.88, increasing by over 1.5% in the last 24 hours.

The RSI-14 trend line has surged from its previous level and currently hovers around 64, showing that bulls are slowly gaining momentum in the price. The SMA-14 level suggests upward volatility in the next few hours.
Manta/USDT 4-hour price chart: Bulls aim for a hold above EMA lines
The 4-hour Manta price chart suggests MANTA continues to bullish activity near EMA lines, creating a positive sentiment on the price chart. Currently, buyers aim for a surge by holding the price above the EMA20 trend line.

The BoP indicator trades in a negative region at 0.88, hinting that sellers are trying to build pressure near support levels and boost a downward correction.
Additionally, the MACD trend line has formed red candles below the signal line, and the indicator aims for negative momentum, strengthening bearish positions.
Manta Price Prediction: Levels And Action
Daily Simple Moving Average (SMA)
| Period | Value | Action |
| SMA 3 | $ 0.651675 | SELL |
| SMA 5 | $ 0.644122 | SELL |
| SMA 10 | $ 0.689918 | SELL |
| SMA 21 | $ 0.730693 | SELL |
| SMA 50 | $ 0.810178 | SELL |
| SMA 100 | $ 1.026748 | SELL |
| SMA 200 | $ 1.758745 | SELL |
Daily Exponential Moving Average (EMA)
| Period | Value | Action |
| EMA 3 | $ 0.705615 | SELL |
| EMA 5 | $ 0.706161 | SELL |
| EMA 10 | $ 0.709693 | SELL |
| EMA 21 | $ 0.743097 | SELL |
| EMA 50 | $ 0.871671 | SELL |
| EMA 100 | $ 1.157613 | SELL |
| EMA 200 | $ 1.537801 | SELL |
What to expect from Manta price analysis next?
The hourly price chart confirms bears are making efforts to prevent the Manta price from an immediate surge. However, if the Manta price successfully breaks above $0.97, it may surge higher and touch the resistance at $1.1.
If bulls cannot initiate a surge, Manta’s price may drop below the immediate support line at $0.85, resulting in a correction to $0.64.
Is MANTA A Good Investment?
Manta’s rapid rise in DeFi TVL charts and alignment with Ethereum‘s scaling roadmap via technologies like Manta Pacific suggest $MANTA’s potential. Grants support its ecosystem growth, and it leads in ZK technology adoption, promising for blockchain‘s future. However, regulatory concerns over transaction privacy could affect its long-term viability, potentially impacting ZK protocols like $MANTA. Overall, Manta is a good investment if you want a profitable return in the long term.
Why is Manta Price Up Today?
Following intense bearish market sentiment, MNT price declined heavily and tested buyers’ patience at $0.6. However, as the BTC price now aims for a minor recovery, it triggered a bullish surge for the Manta price toward $0.65.
Will Manta Price Reach $10?
In recent months, the Manta network has been expanding its offerings and establishing multiple partnerships. If buying demand continues to increase in the coming years, its price might surpass the $10 mark.
Will Manta Reach $100?
Depending on the current market sentiment, the MNT price might take several years to reach the $100 milestone. We expect the Manta price to achieve $100 by 2060.
Will Manta Reach $1000?
$1000 is a distant dream for Manta price. However, if everything remains in favor of the altcoin market, we might even see the MNT price hitting $1K.
Is Manta a Good Long-Term Investment?
Investors are bullish on Manta, which has gained significant attention in recent months. If developers continue to build robust utilities for Manta and the roadmap fulfills user demand, it can be a good long-term investment option.
Recent MANTA News/Opinions
CeDeFi: Manta CeDeFi merges CeFi and DeFi to unlock new earning opportunities for crypto holders through stable strategy arbitrage, DeFi yields, and $MANTA token incentives, all secured by institutional-grade compliance.
DDoS Attack: The emerging Manta Network experienced a distributed denial of service (DDoS) attack during the issuance of its MANTA token, resulting in delayed withdrawals and slowed network performance. Manta developers acknowledged in an X post that a significant backlog of transactions was causing extended transaction times and affecting gas fees.
MANTA Price Prediction September 2024
If the altcoin market witnesses a surge in buying pressure this month, we might see a rebound in the MANTA price. In September, we expect Manta price to record a minimum level of $0.4 and a maximum level of $0.9. The average price is expected to be around $0.6.
| Manta Price Prediction | Potential Low | Potential Average | Potential High |
| Manta Price Prediction September 2024 | $0.4 | $0.6 | $0.9 |
Manta Price Prediction 2024
Q1 2024 started with Bitcoin ETF approvals, but the quarter will likely remain quiet as key developments are expected later. The Ethereum Dencun upgrade, crucial for rollups like Manta, may be delayed to Q2 or Q3 due to complexity.
The Bitcoin halving in April, possible Ethereum ETF approval, and expected Fed interest rate cuts could significantly impact crypto prices. An expanding Manta ecosystem and a potential bull market in late 2024 are set to boost crypto growth.
In 2024, Manta Network is anticipated to reach a minimum price of $2.12. Based on our analysis, the maximum possible price for MANTA is estimated to be $2.47, with an average price forecast of around $2.20.
| Manta Price Prediction | Potential Low | Potential Average | Potential High |
| Manta Price Prediction 2024 | $2.12 | $2.2 | $2.47 |
Manta Price Predictions 2025-2030
| Year | Minimum Price ($) | Average Price ($) | Maximum Price ($) |
| 2025 | 3.03 | 3.14 | 3.60 |
| 2026 | 4.23 | 4.38 | 5.19 |
| 2027 | 6.25 | 6.43 | 7.60 |
| 2028 | 8.55 | 8.81 | 10.75 |
| 2029 | 12.96 | 13.31 | 15.02 |
| 2030 | 17.94 | 18.60 | 22.28 |
Manta Price Prediction 2025
Due to the impact of Bitcoin’s halving in 2025, Bitcoin and leading altcoins could reach new highs. However, some believe the event’s predictability changes because of crypto’s current popularity.
Technical analysis indicates that in 2025, Manta Network is expected to reach a minimum price of $3.03. The MANTA token might attain a maximum price of $3.60, while the average trading price is $3.14.
MANTA Price Prediction for 2026
Ethereum upgrades will benefit Manta Network as it advances toward a rollup-based model. With growing interest in privacy tech like ZK solutions, Manta Network is poised to grow, likely increasing its token value.
In 2026, Manta Network will have a minimum price of $4.23. The MANTA token is expected to reach a maximum price of $5.19, with an average price of $4.38.
Manta Price Prediction 2027
By 2027, Manta Network is predicted to have a minimum value of $6.25. It may reach a maximum value of $7.60, with an average trading price of $6.43.
Manta Network Price Prediction 2028
Through a detailed technical analysis of past price data, Manta Network is estimated to reach a minimum price of $8.55 in 2028. The token could see a maximum price of $10.75, with an average trading price of $8.81.
Manta Price Prediction 2029
In 2029, the minimum expected price for one Manta Network token is projected to be $12.96. The maximum price could reach $15.02, with an average trading price of $13.31.
Manta Price Prediction 2030
For 2030, the Manta price prediction is a minimum of $17.94. According to our research, the MANTA token could achieve a maximum of $22.28, with an average forecast price of $18.60.

Manta Network Price Prediction: Analysts’ MANTA Price Forecast
| Firm Name | 2024 | 2025 |
| Coincodex | $5 | $7.92 |
| DigitalCoinPrice | $3.68 | $4.28 |
| Changelly | $2.65 | $3.92 |
Cryptopolitan’s Manta Price Prediction
At Cryptopolitan, we are bullish on Manta’s price prediction as it flashes bullish on-chain signals amid growing buying demand. Investors are keenly watching the Manta Network market to discern potential movements in its future price trends and analyze shifts in Manta Network’s price.
We expect Manta price to reach a minimum price of $2.12. Based on our analysis, the maximum possible price for MANTA is estimated to be $2.47, with an average price forecast of around $2.20.
Manta Historic Price Sentiment
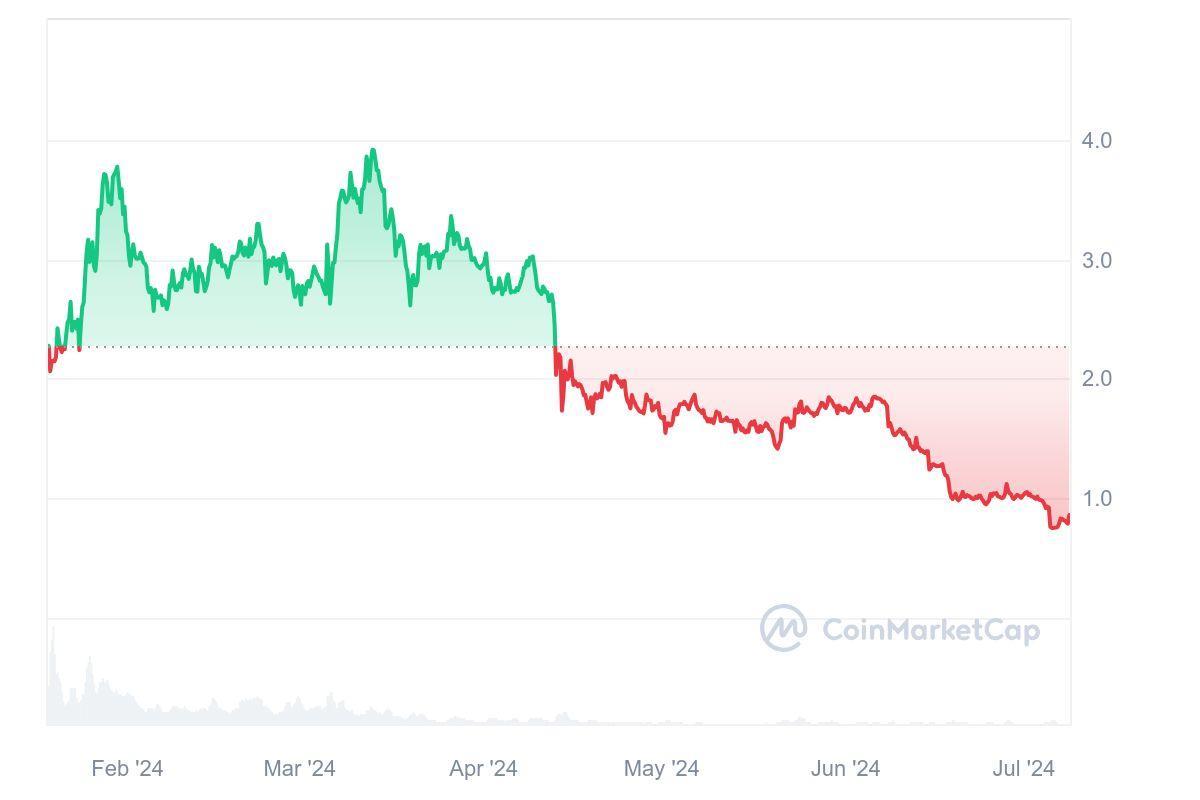
- January 18, 2024: MANTA launched on the open market at approximately $2.24.
- January 22, 2024: Price rose steadily, exceeding $2.70 before retracting to $2.40.
- Bullish Rebound: Following months showed a strong upward trend, with MANTA reaching an all-time high of $4 in March.
- April Decline: Momentum faded, and the price declined below $2.
- In May, the price of Manta rebounded and is aimed for a retest of the $2 mark.
- In recent weeks of June, MNT price declined heavily and dropped below the $1 mark.
- In July, Manta price continued its bearish move as it settled below the $1 mark.
- In August, the price of Manta surged toward $0.86; however, it later dropped toward $0.6.
Recommended Articles


