

Crypto Today: Bitcoin, Ethereum dip slightly, XRP flat on Monday as dormant Ether whale is back in action
- Bitcoin, Ethereum trade sideways on Monday, hovering around $58,000 and $2,300, respectively.
- XRP trades in a narrow range at around $0.5700 at the start of the American session.
- A dormant Ethereum whale transferred Ether received in 2016, likely to increase selling pressure on the altcoin.
Bitcoin, Ethereum and XRP updates
- Bitcoin trades at around $58,500 at the time of writing. BTC has slightly corrected since the weekend after being unable to hold the key physiological $60,000 level. It is likely that traders have changed their approach to risk assets ahead of the important US macroeconomic developments this week.
- Ethereum trades at around $2,300 on Monday. At the time of writing, the second largest cryptocurrency by market capitalization erases 0.62% of its value on the day. ETH could face increasing selling pressure if dormant whales and Ether holders transfer their holdings to crypto exchanges.
- XRP trades in a narrow range around $0.5700 at the start of the American session on Monday.
Chart of the day: Notcoin (NOT)
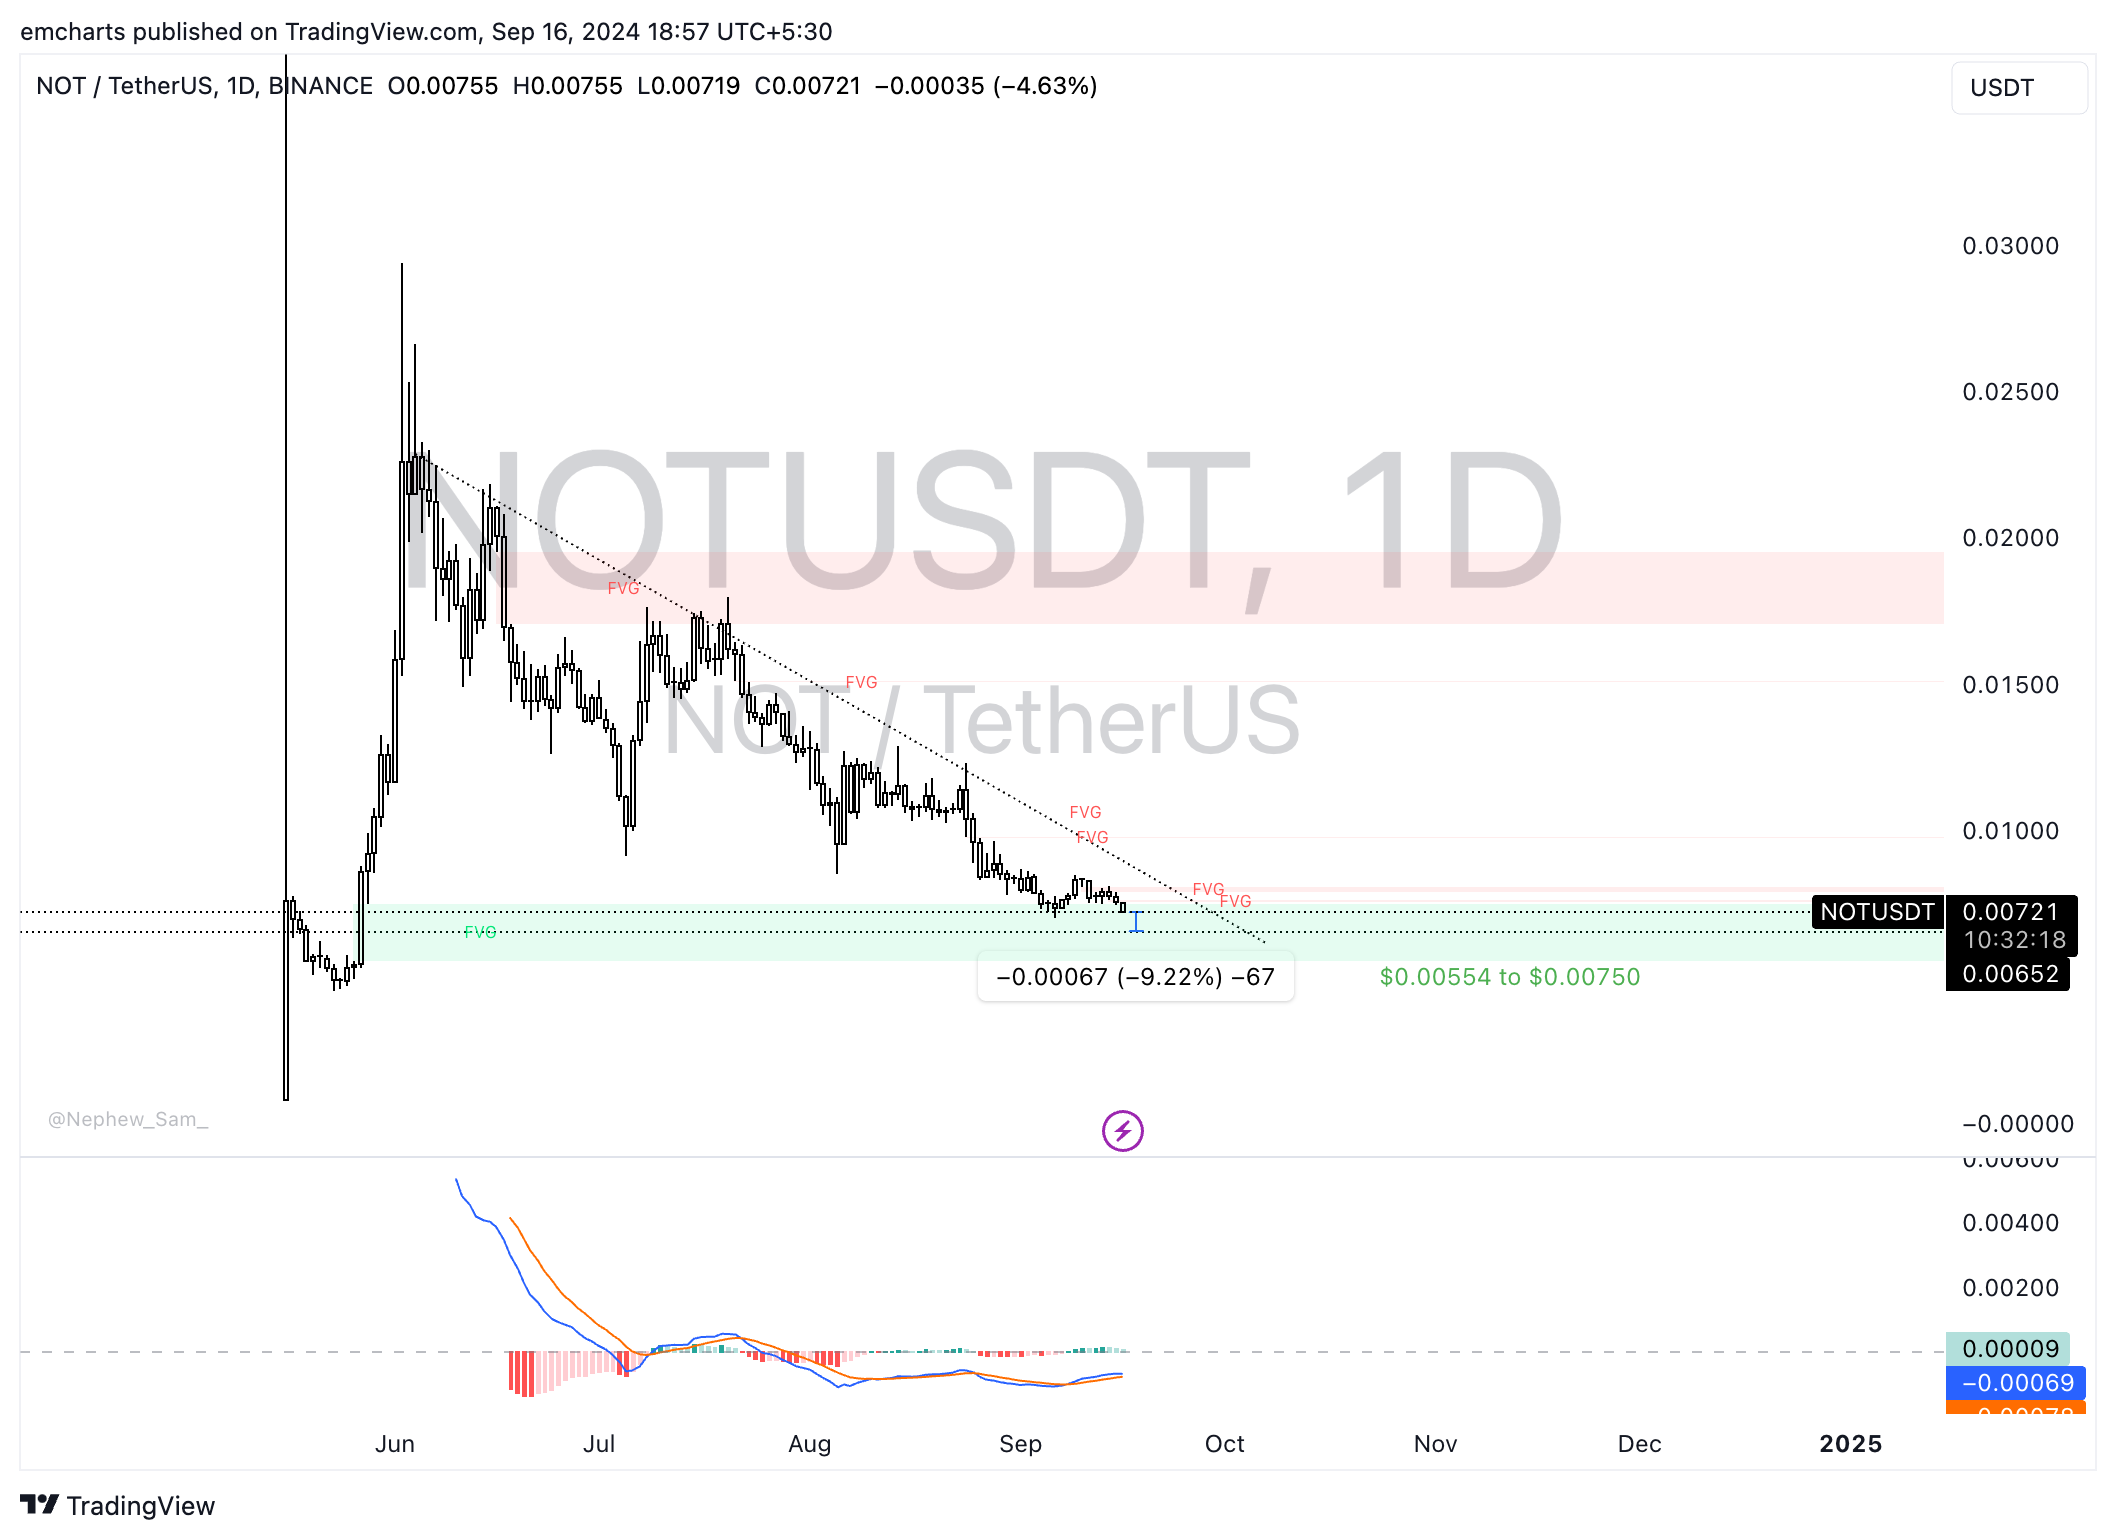
NOT/USDT daily chart
Notcoin (NOT) is in a downward trend. At the time of writing, the token erased 4.76% of its value on the day and is likely to extend its decline further. There is a Fair Value Gap (FVG) between $0.00554 and $0.00750 on the NOT/USDT daily chart, which offers support for NOT’s price.
The midpoint of the FVG is $0.00652. There is a high likelihood that NOT dips to this level to collect liquidity before attempting a recovery. The Moving Average Convergence Divergence (MACD) indicator flashes green histogram bars above the neutral line, supporting an underlying positive momentum in the NOT price trend.
NOT could attempt a recovery to $0.00847, the August 23 high.
Market updates
- Binance launched Neiro (NEIRO), Turbo (TURBO), and Baby Doge Coin (100000BABYDOGE) at 10:00 GMT on Monday, and opens spot trading pairs with USD Tether (USDT). Neiro (NEIRO) is a meme coin on the Ethereum chain, Turbo is a meme coin created by AI for people, and Baby Doge is a meme on the Binance smart chain (BSC), per an official announcement.
- An Ethereum whale who received 16,636 Ether from ShapeShift at $5.23 per ETH in February 2016 sold 350 tokens from the holdings at an average price of $2,350, per Etherscan data.
- The government of the UK introduced a bill to the Parliament, focused on the legal status of cryptocurrencies, Non-fungible tokens (NFTs), and tokenized real-world assets (RWAs), on September 11.
Industry updates
- Circle, the USD Coin (USDC) issuer, partners with Sony to integrate the stablecoin as a primary token on Soneium. The partnership is geared at enhancing the security, user-friendly Web3 experiences and creators.
We’re excited to announce our collaboration with Sony Block Solutions Labs to bring bridged USDC on Soneium via our Bridged USDC Standard! This marks a significant milestone to set the stage for a new era of creativity in the Web3 space.
— Circle (@circle) September 16, 2024
Read more about the collaboration here:… pic.twitter.com/0IRxrXhf5P
- The issuer of the USDC stablecoin is moving headquarters from Boston to New York City, as the integration of blockchain technology in financial services continues at a fast pace.
- Binance, one of the largest crypto exchanges, warned users of a global malicious software, “Clipper malware,” that intercepts data stored on keyboards, such as crypto wallet addresses, in a blog post.
Recommended Articles


