

Bitcoin price struggles around $67,000 as US Government transfers, Mt. Gox funds movement weigh
- Bitcoin spot ETFs received $530.20 million of inflows on Monday.
- The US Government's and Mt. Gox funds movement on Monday may negatively impact Bitcoin's price.
- On-chain data shows that Bitcoin Exchange Depositing Addresses are decreasing, signaling growing confidence among investors.
Bitcoin (BTC) struggles around the $67,000 mark and declines by 1.7% at the time of writing on Tuesday at around $66,350. Bitcoin spot ETFs saw significant inflows of $530.20 million on Monday. However, movements involving the US Government and Mt. Gox potentially exerted downward pressure on Bitcoin's price. Concurrently, on-chain data reveals a decrease in Bitcoin Exchange Depositing Addresses, indicating rising investor confidence in holding their assets.
Daily digest market movers: Bitcoin spot ETF received $530.20 million in inflows on Monday
- According to Coinglass Bitcoin Spot ETF data, inflows of $530.20 million occurred on Monday, the highest since June 5. Monitoring these ETFs' net flow data is crucial for understanding market dynamics and investor sentiment. The combined Bitcoin reserves held by the 11 US spot Bitcoin ETFs stand at $53.16 billion.
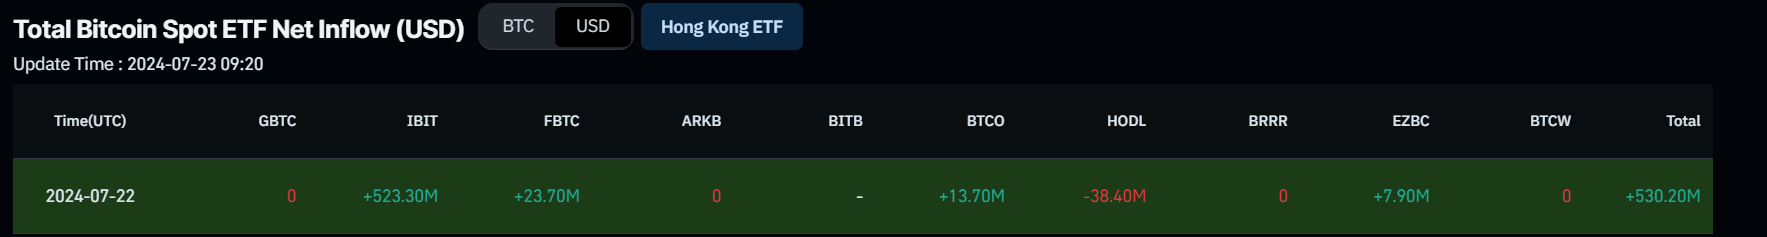
Total Bitcoin Spot ETF Net Inflow (USD) chart
- Data from Arkham Intelliengnce shows that Mt. Gox addresses deposited $1 to 4 separate Bitstamp deposit addresses. Bitstamp is 1 of 5 exchanges working with the Mt. Gox Trustee to facilitate creditor repayments. These transfers are likely to represent test transactions. Mt. Gox currently holds $6.08 billion in Bitcoin.
THIS MORNING: MT GOX MOVING FUNDS
— Arkham (@ArkhamIntel) July 22, 2024
Mt. Gox addresses deposited $1 to 4 separate Bitstamp deposit addresses. Bitstamp is 1 of 5 exchanges working with the Mt. Gox Trustee to facilitate creditor repayments.
Mt. Gox currently holds: $6.08B in BTC
These transfers are likely to… pic.twitter.com/uyOLL7O065
- Furthermore, data from Lookonchain reveals that the US Government transferred 58.74 BTC valued at $3.96 million to CoinbasePrime, increasing its total holdings to 213,239 BTC worth $14.42 billion. This unexpected transfer of funds may have triggered FUD (Fear, Uncertainty, Doubt) among traders, potentially contributing to Bitcoin's 1% price decline on Monday.
The #USGovernment transferred 58.74 $BTC($3.96M) to #CoinbasePrime 7 hours ago and currently holds 213,239 $BTC($14.42B).https://t.co/erV5T8x6eU pic.twitter.com/HY1CdpRQiP
— Lookonchain (@lookonchain) July 23, 2024
- Data from the CryptoQuant Bitcoin Exchange Depositing Addresses metric provides insights into the flow of Bitcoin into exchanges, which can be useful for understanding market dynamics and investor behavior.
- The decrease in deposit addresses to 25,000 signifies a pivotal signal suggesting a shift in Bitcoin holders' strategy. The reduction in addresses available for selling Bitcoin indicates a preference among investors to hold onto their assets, anticipating potential price appreciation.
- This trend reflects growing confidence among Bitcoin investors, potentially influenced by factors such as increased institutional involvement in cryptocurrencies. Reduced selling activity could limit Bitcoin supply, potentially leading to price increases amid steady or rising demand. This development is bullish, signaling expectations of higher future values in the market.
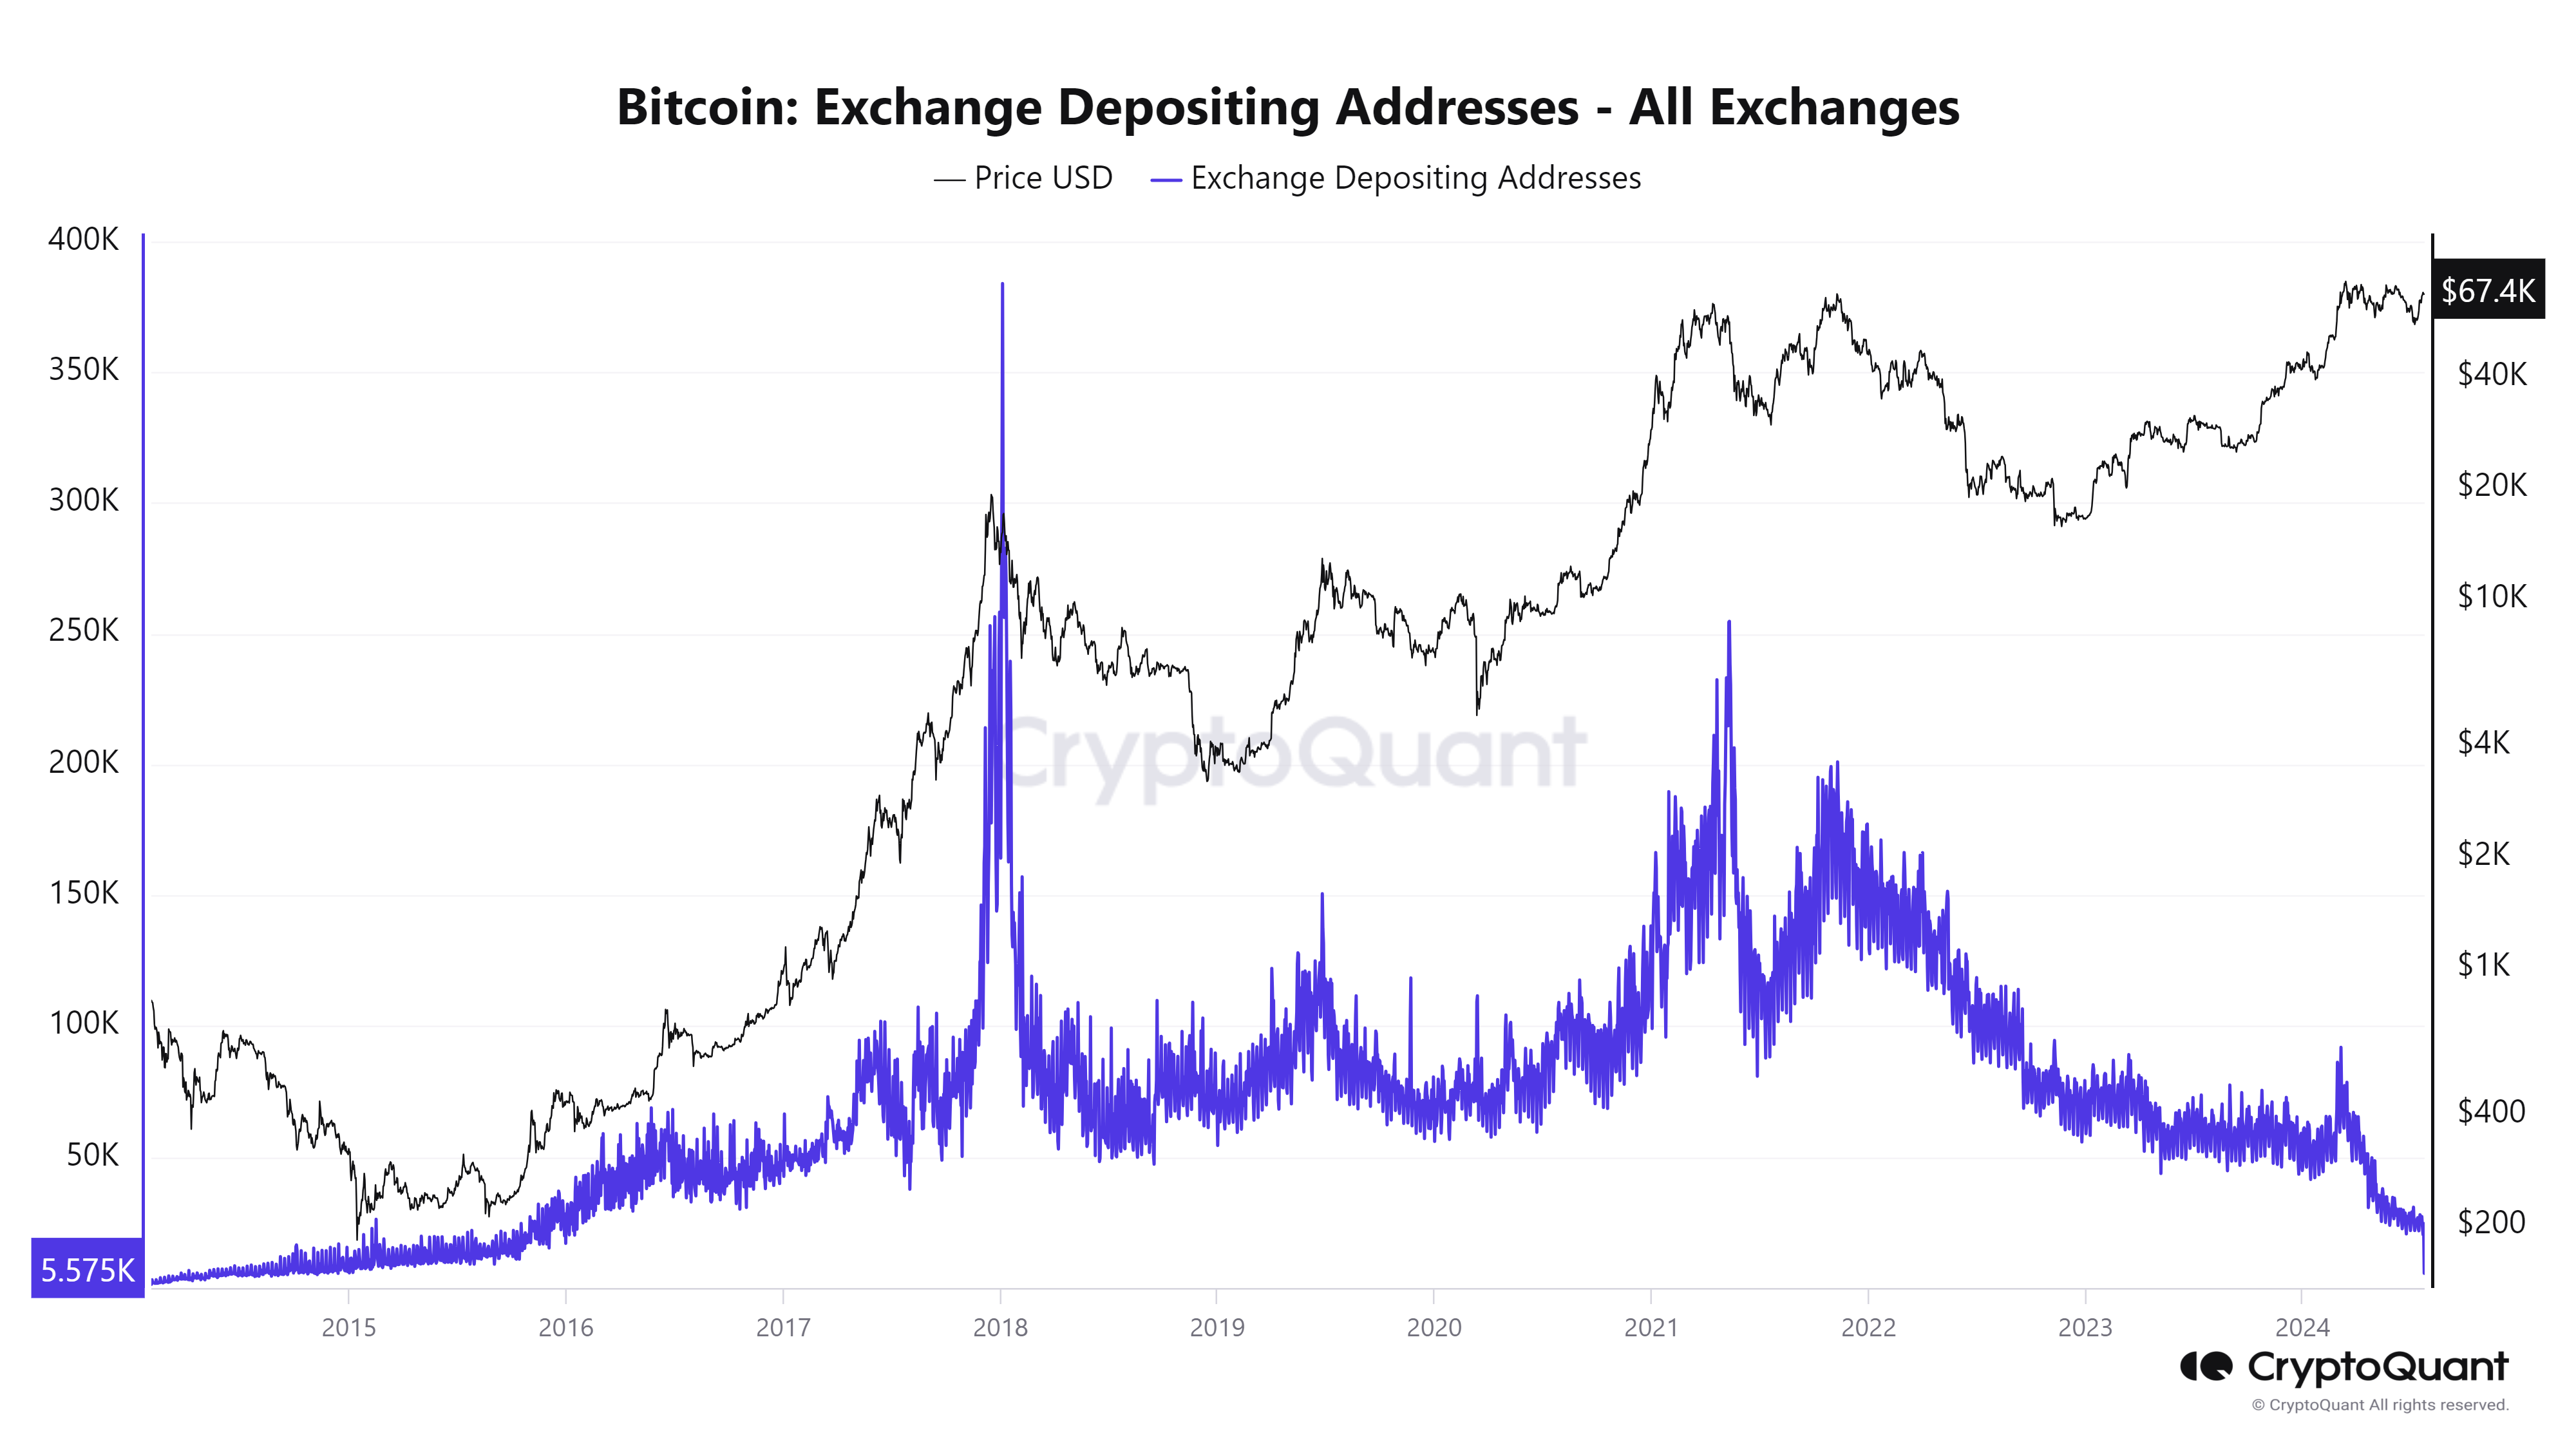
Bitcoin Exchange Depositing Addresses chart
Technical analysis: BTC struggles around the $67,000 mark
Bitcoin’s price surpassed the weekly level of $67,209 on Sunday, halting its recent upward movement. As of Tuesday, BTC retraces and trades at around $66,350 at the time of writing.
If BTC continues to retrace, it could find support at the following levels.
- The weekly level at $67,209.
- The daily level at $64,913 coincides closely with the 61.8% Fibonacci retracement at $64,921, derived from the June 7 high of $71,997 to the July 5 low of $53,475, establishing a critical zone of support that should be monitored closely.
If the weekly support at $67,209 holds, BTC could rally 7% to retest its June 7 high of $71,997.
If BTC continues to retrace, it could find support at the daily level of $64,913, coinciding closely with the 61.8% Fibonacci retracement level at $64,921, derived from the June 7 swing high of $71,997 on June 7 to the July 5 swing low of $53,475 on July 5, establishing a critical zone of support that should be monitored closely.
If this area of support at $64,913 holds, BTC could rally 11% to retest its June 7 daily high of $71,997.
On the daily chart, the Relative Strength Index (RSI) and the Awesome Oscillator (AO) are trading above their respective neutral levels of 50 and zero, respectively. This robust momentum signals a strong bullish sentiment in the market.
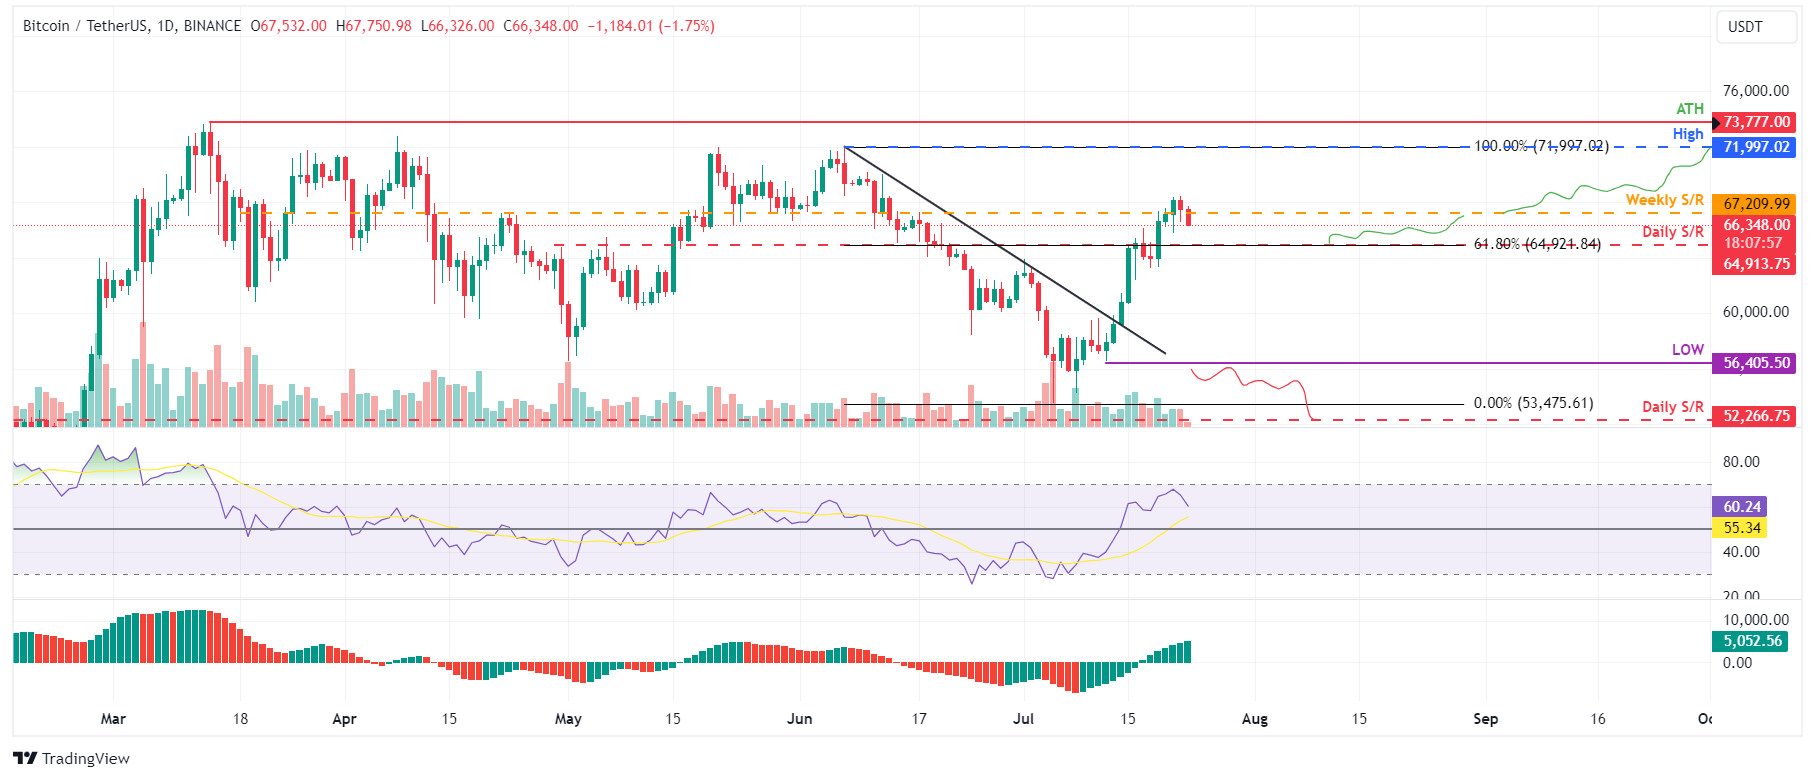
BTC/USDT daily chart
However, a close below $56,405, accompanied by a formation of a lower low on the daily timeframe, could indicate sustained bearish sentiment. Such a scenario might precipitate a 7.5% decline in Bitcoin's price, potentially leading to its daily support level at $52,266.
Bitcoin, altcoins, stablecoins FAQs
Bitcoin is the largest cryptocurrency by market capitalization, a virtual currency designed to serve as money. This form of payment cannot be controlled by any one person, group, or entity, which eliminates the need for third-party participation during financial transactions.
Altcoins are any cryptocurrency apart from Bitcoin, but some also regard Ethereum as a non-altcoin because it is from these two cryptocurrencies that forking happens. If this is true, then Litecoin is the first altcoin, forked from the Bitcoin protocol and, therefore, an “improved” version of it.
Stablecoins are cryptocurrencies designed to have a stable price, with their value backed by a reserve of the asset it represents. To achieve this, the value of any one stablecoin is pegged to a commodity or financial instrument, such as the US Dollar (USD), with its supply regulated by an algorithm or demand. The main goal of stablecoins is to provide an on/off-ramp for investors willing to trade and invest in cryptocurrencies. Stablecoins also allow investors to store value since cryptocurrencies, in general, are subject to volatility.
Bitcoin dominance is the ratio of Bitcoin's market capitalization to the total market capitalization of all cryptocurrencies combined. It provides a clear picture of Bitcoin’s interest among investors. A high BTC dominance typically happens before and during a bull run, in which investors resort to investing in relatively stable and high market capitalization cryptocurrency like Bitcoin. A drop in BTC dominance usually means that investors are moving their capital and/or profits to altcoins in a quest for higher returns, which usually triggers an explosion of altcoin rallies.
Recommended Articles


