Solana Price Forecast: SOL risks $100 breakdown as ETF outflows mount

Source Fxstreet
  • Solana extends losses on Thursday after retreating over 2% from its 50-day EMA at $107.13 the previous day.
  • SOL-focused ETFs recorded over $1 million in redemptions, marking their eighth consecutive day of outflows.
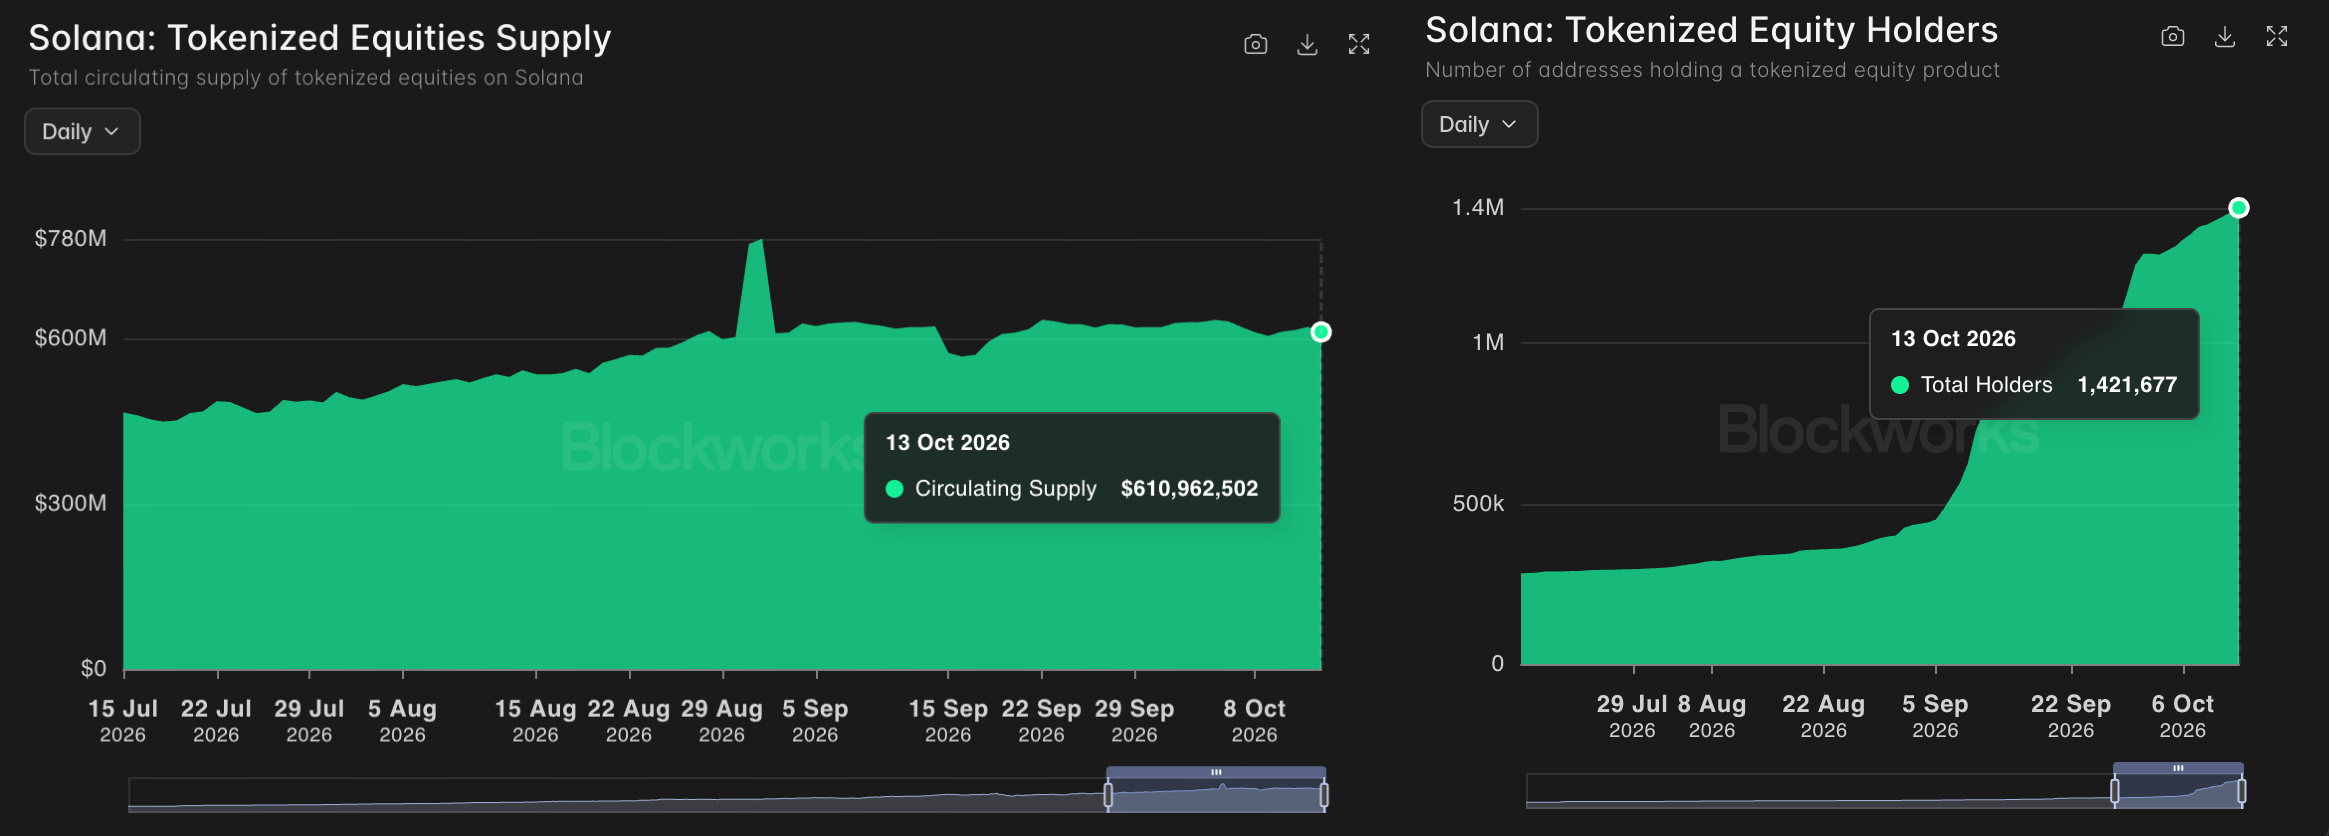
  • Solana sees steady growth in tokenized assets, with over $600 million in tokenized equity supply across 1.4 million holders.

Solana (SOL) price extends losses on Thursday, inching lower to the $100 mark after a 2% retreat from the 50-day Exponential Moving Average (EMA) at $107.13 the previous day. The institutional demand remains weak, with eight consecutive days of outflows from SOL-focused Exchange Traded Funds (ETFs). Tokenized assets rise on Solana, with over $600 million in tokenized equity supply across 1.4 million holders.

The technical outlook for Solana indicates a downside bias as bearish pressure mounts.

Solana ETFs face consistent selling pressure

Solana-focused ETFs are experiencing an extended selloff, driven by consistent investor redemptions over the last week. SoSoValue data shows SOL ETFs marked their eighth consecutive day of outflows, with $1.29 million on Wednesday and extending last week’s $24.81 million.

On the other hand, the tokenized assets on Solana are rising. Blockworks data shows tokenized equity supply rising to nearly $611 million on Tuesday, distributed across 1.42 million holders. 
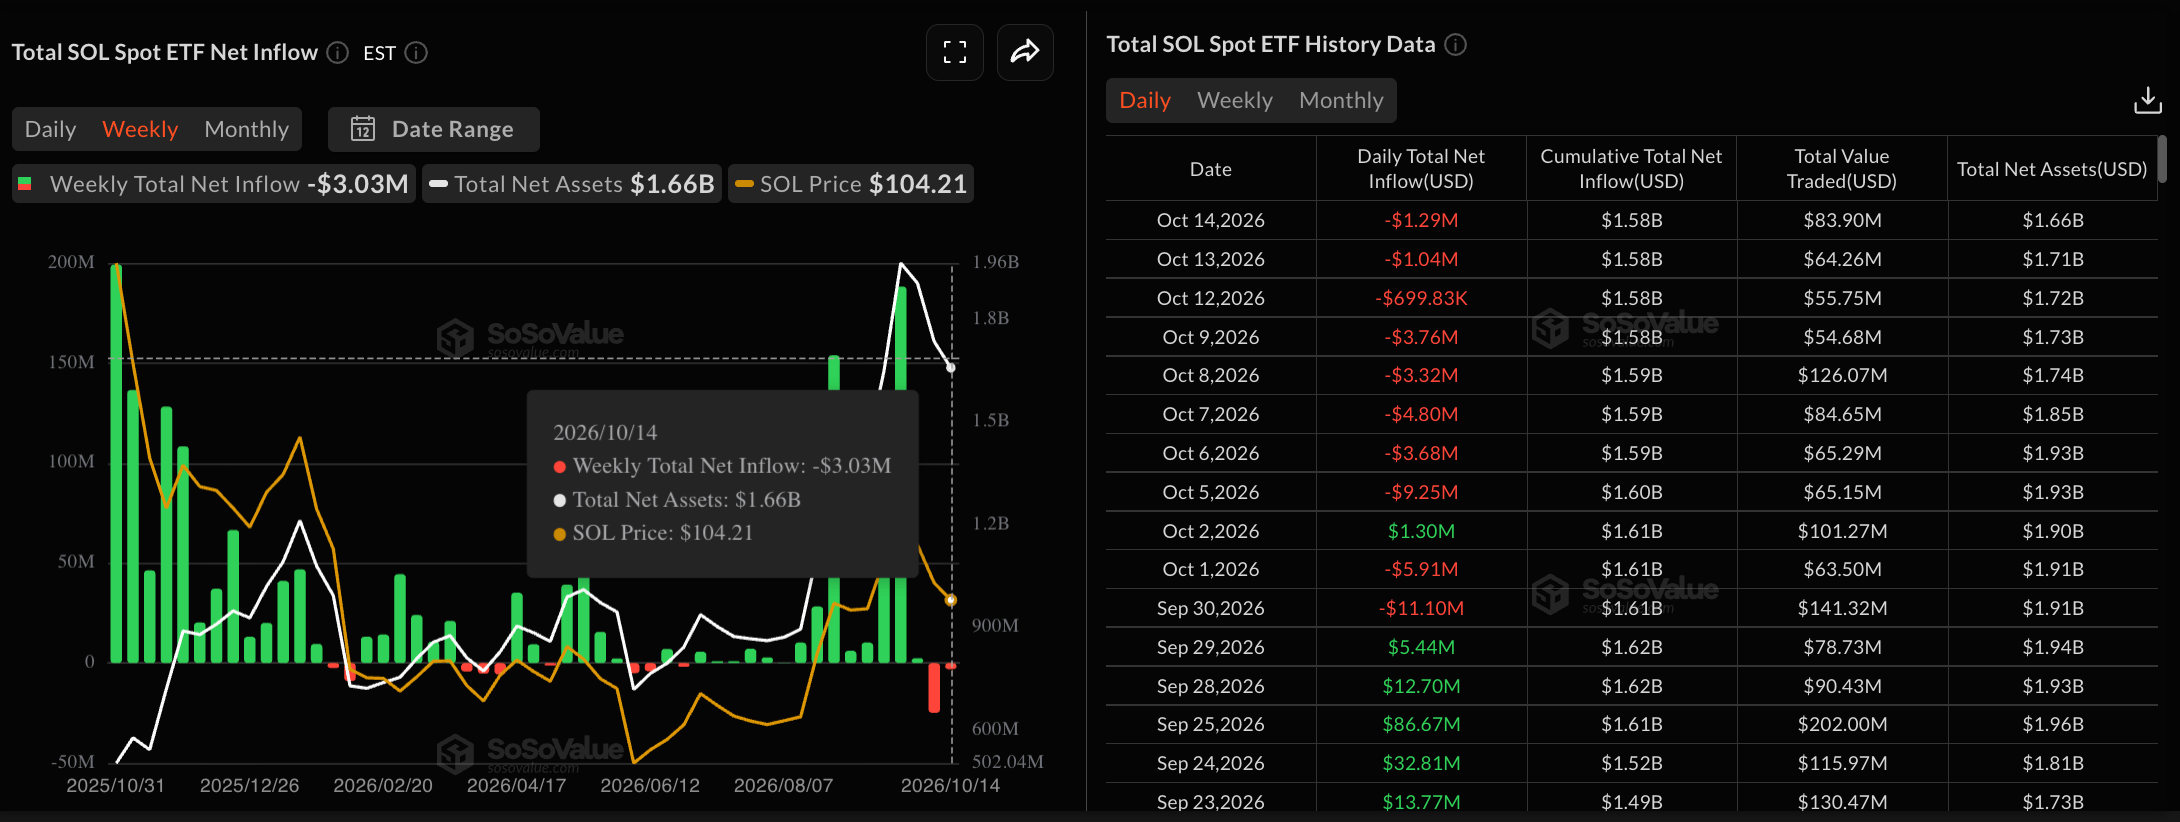
SOL ETFs data. Source: Sosovalue
Solana tokenized assets data. Source: Blockworks

Technical outlook: Could Solana's price fall below $100?

Solana trades around $102.50 at press time on Thursday, maintaining a bearish near-term bias after a double-top reversal from $122 in early October. The SOL price is down over 13% so far in October, crossing below the 50-day EMA at $107.13. Still, SOL remains above the 200-day EMA at $97.95, suggesting a corrective phase within a broader uptrend.

Downside pressure remains firm on the daily chart, with the Moving Average Convergence Divergence (MACD) below its signal and zero line, while the Relative Strength Index (RSI) near 35 suggests that sellers remain in control.

Looking down, the 200-day EMA at $97.95 offers the first meaningful support zone. A clear drop through this level would likely expose deeper losses, aligning with the May 17 high at $83.50.

Chart Analysis SOL/USDT (Binance)
SOL/USDT daily price chart.

On the flip side, initial resistance is located at the 50-day EMA around $107.13. A sustained break above this barrier would be needed to ease the current bearish tone before the more distant horizontal cap near the September 25 high at $122.94 comes into view.

(The technical analysis of this story was written with the help of an AI tool. Know more.)

Disclaimer: For information purposes only. Past performance is not indicative of future results.
placeholder
US September PPI Preview: Will Inflation Surprise Again? US Stocks, Dollar and Gold Face Key Test On October 15, US Eastern Time, the U.S. is set to release the September Producer Price Index (PPI). The September CPI released this Wednesday was notably higher than market expectations,
Author  TradingKey
9 hours ago
On October 15, US Eastern Time, the U.S. is set to release the September Producer Price Index (PPI). The September CPI released this Wednesday was notably higher than market expectations,
placeholder
Gold Price Analysis Today | Forex Gold Analysis | XAU/USD Analysis - October 15, 2026Get the latest gold price analysis, forex gold insights, and XAU/USD analysis for October 15, 2026. Read on for the details.
Author  Mitrade
11 hours ago
Get the latest gold price analysis, forex gold insights, and XAU/USD analysis for October 15, 2026. Read on for the details.
placeholder
Gold defends $4,100 as BofA targets a break below $4,000 — why the Middle East bid is missingSpot gold flushed to $4,099.89, a whisker above October's $4,090 low, then rebounded to close at $4,138.25 (+0.82%) — even as US CPI ran hot. Bank of America sees gold below $4,000 within three months, citing shrinking demand and official-sector selling. Here are the levels, the drivers and what would flip the script.
Author  Irene Q.
11 hours ago
Spot gold flushed to $4,099.89, a whisker above October's $4,090 low, then rebounded to close at $4,138.25 (+0.82%) — even as US CPI ran hot. Bank of America sees gold below $4,000 within three months, citing shrinking demand and official-sector selling. Here are the levels, the drivers and what would flip the script.
placeholder
US September CPI recap: inflation hits 3.7% as core runs hot — is an October Fed hike back on the table?September CPI landed hot: headline 3.7% y/y, core 2.6% y/y and 0.3% m/m. October hike odds jumped from ~22% to ~37% — yet the dollar faded to 101.74, gold closed higher and the S&P 500 fell 1.11%. Here is the full repricing, the levels and what to watch next.
Author  Irene Q.
12 hours ago
September CPI landed hot: headline 3.7% y/y, core 2.6% y/y and 0.3% m/m. October hike odds jumped from ~22% to ~37% — yet the dollar faded to 101.74, gold closed higher and the S&P 500 fell 1.11%. Here is the full repricing, the levels and what to watch next.
placeholder
Today’s Market Recap: September CPI Beat Ignites Rate-Hike Concerns; U.S. Stocks Fall Broadly, Oracle Drops Over 8%, SK Hynix Slips More Than 6%On October 14, Eastern Time, U.S. September CPI data came in higher than market expectations, fueling expectations of a Fed rate hike in October and dampening mar
Author  TradingKey
17 hours ago
On October 14, Eastern Time, U.S. September CPI data came in higher than market expectations, fueling expectations of a Fed rate hike in October and dampening mar
Related Instrument
goTop
quote