

Solana Price Forecast: SOL rally remains capped as ETF inflows ease

Source Fxstreet
  • Solana hovers around $120 on Monday, ticking lower after four consecutive days of recovery.
  • SOL-focused ETF inflows fell below $2.50 million last week, suggesting easing institutional demand.
  • The technical outlook for SOL remains mildly bullish, with a triangle pattern forming on the four-hour chart.

Solana (SOL) price edges lower on Monday, hovering around $120 after four consecutive days of trading in the green. The institutional support for SOL eased last week, with total inflows of less than $2.50 million, from over $188 million in the previous week. The technical outlook for SOL remains mildly bullish, forming a triangle pattern on the four-hour chart.

Mixed institutional support

Solana sees a steep decline in total weekly inflows from Exchange-Traded Funds (ETFs). SoSoValue data shows SOL-focused ETFs recorded $2.43 million in inflows last week, down from $188.22 million, marking its 14th consecutive positive week but significantly reduced institutional demand.
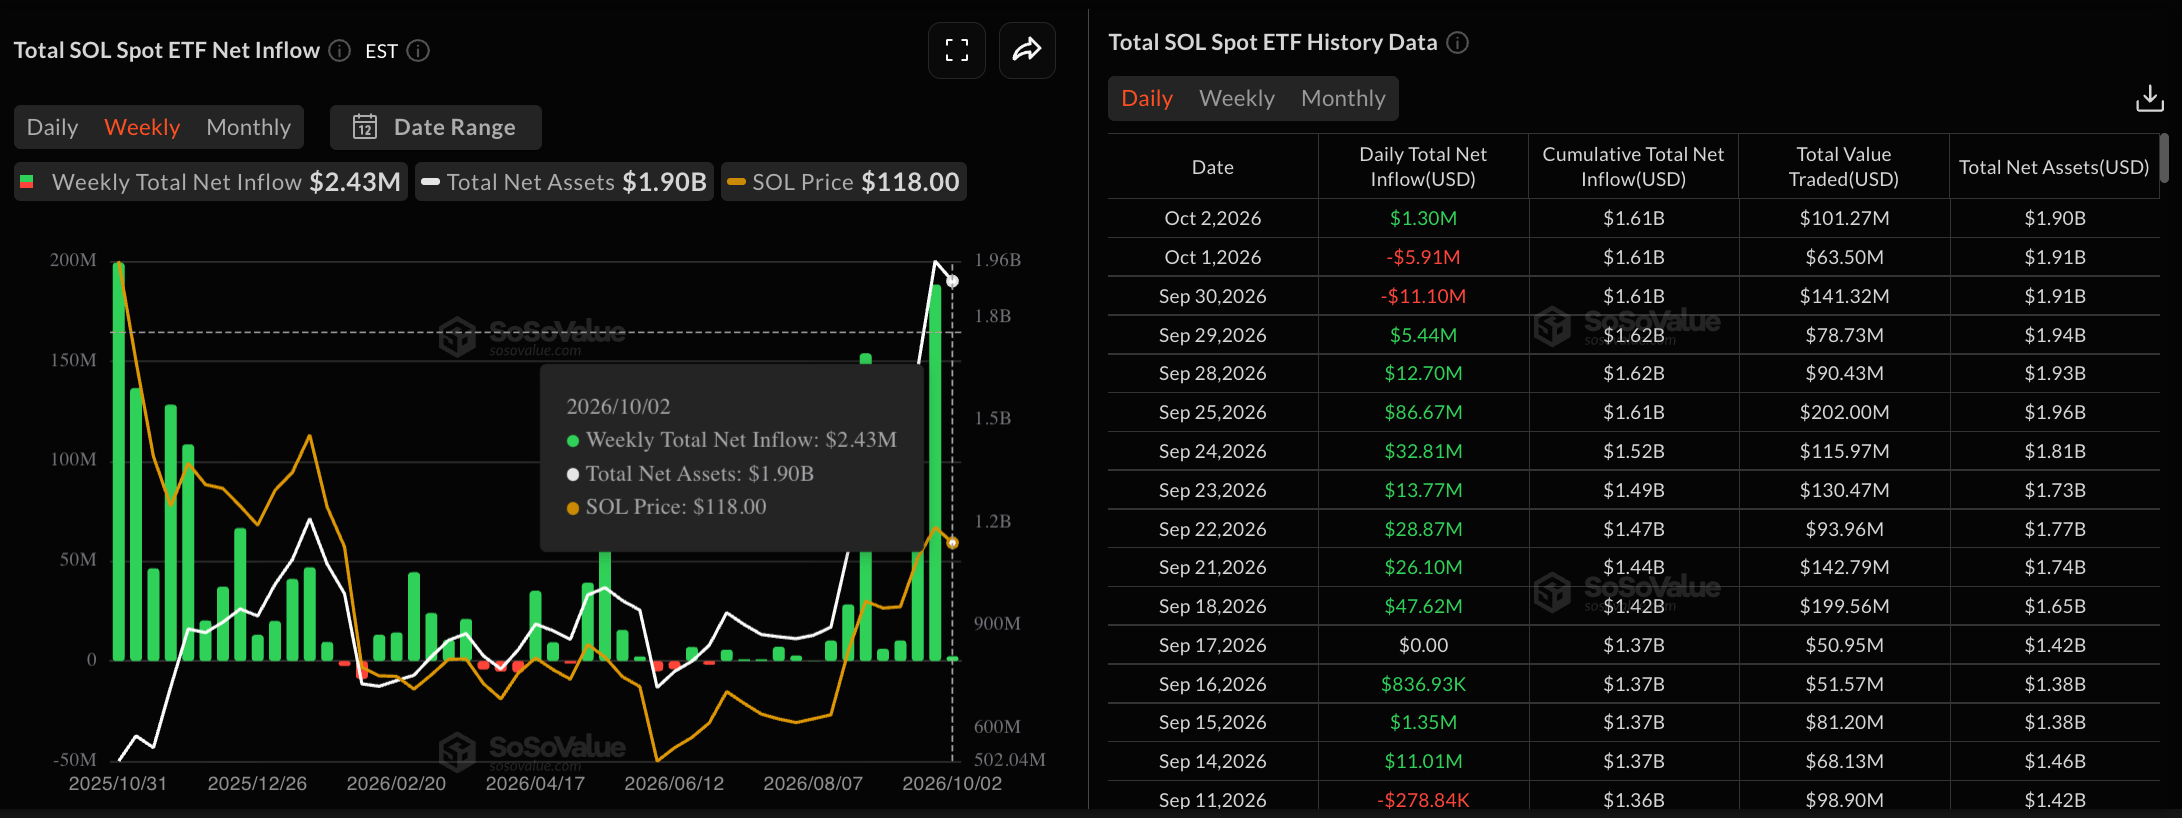
SOL ETFs data. Source: Sosovalue

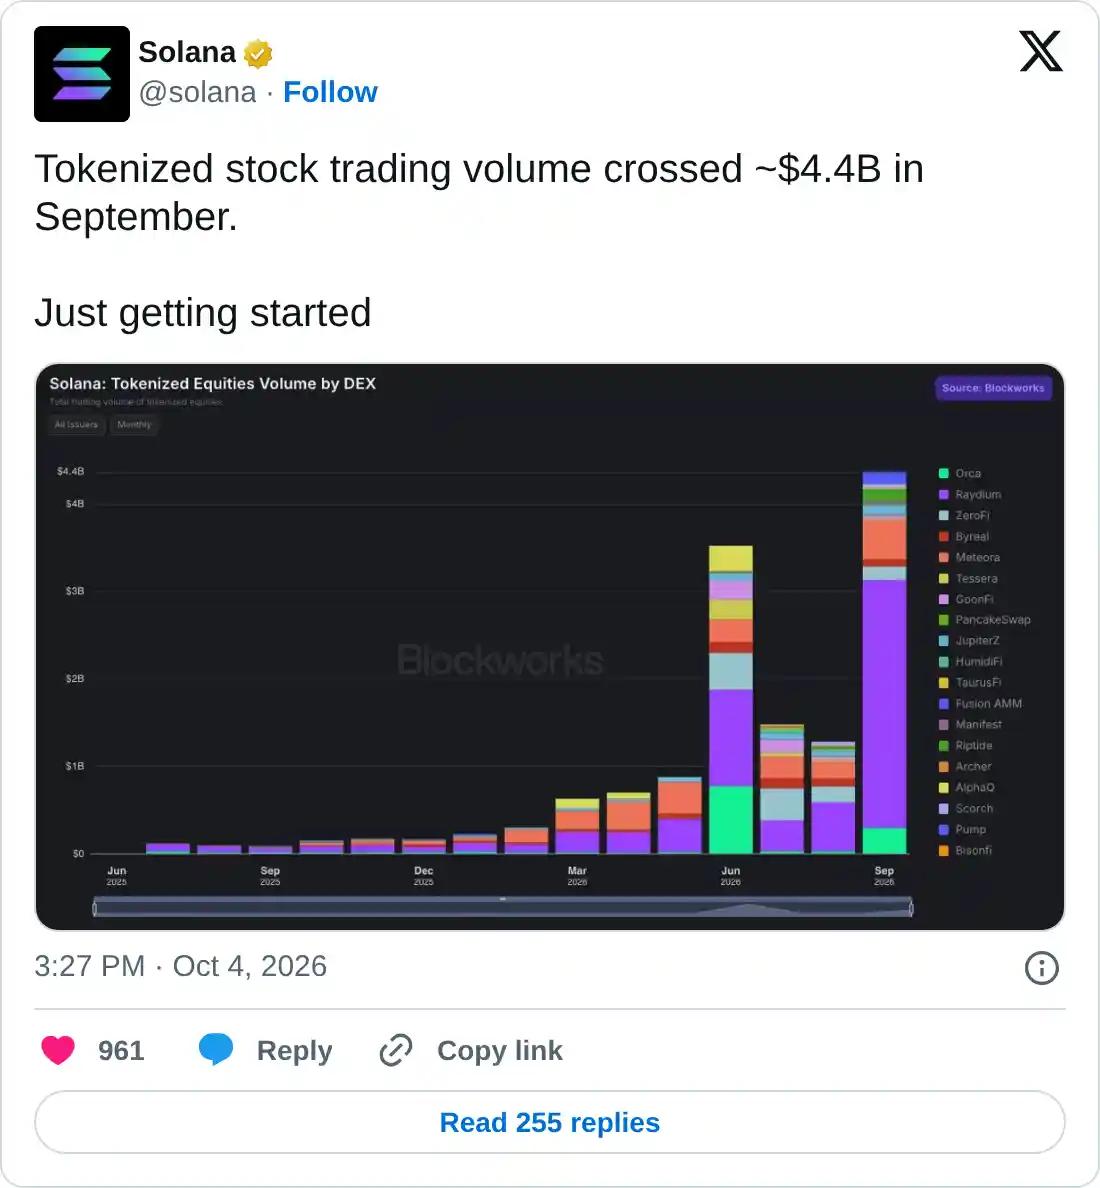
The Solana network shows steady growth despite easing institutional inflows. SolanaFloor data shows that Solana DEX trading volume on Sunday surpassed the combined volume of Ethereum mainnet, its Layer-2 protocols, and Hyperliquid. In addition, the Real-World Assets (RWAs) trading on Solana witnessed over $4.4 billion in volume from tokenized stocks. This suggests early signs of bringing traditional equities to the Solana ecosystem to bridge the gap between crypto and the broader capital markets.
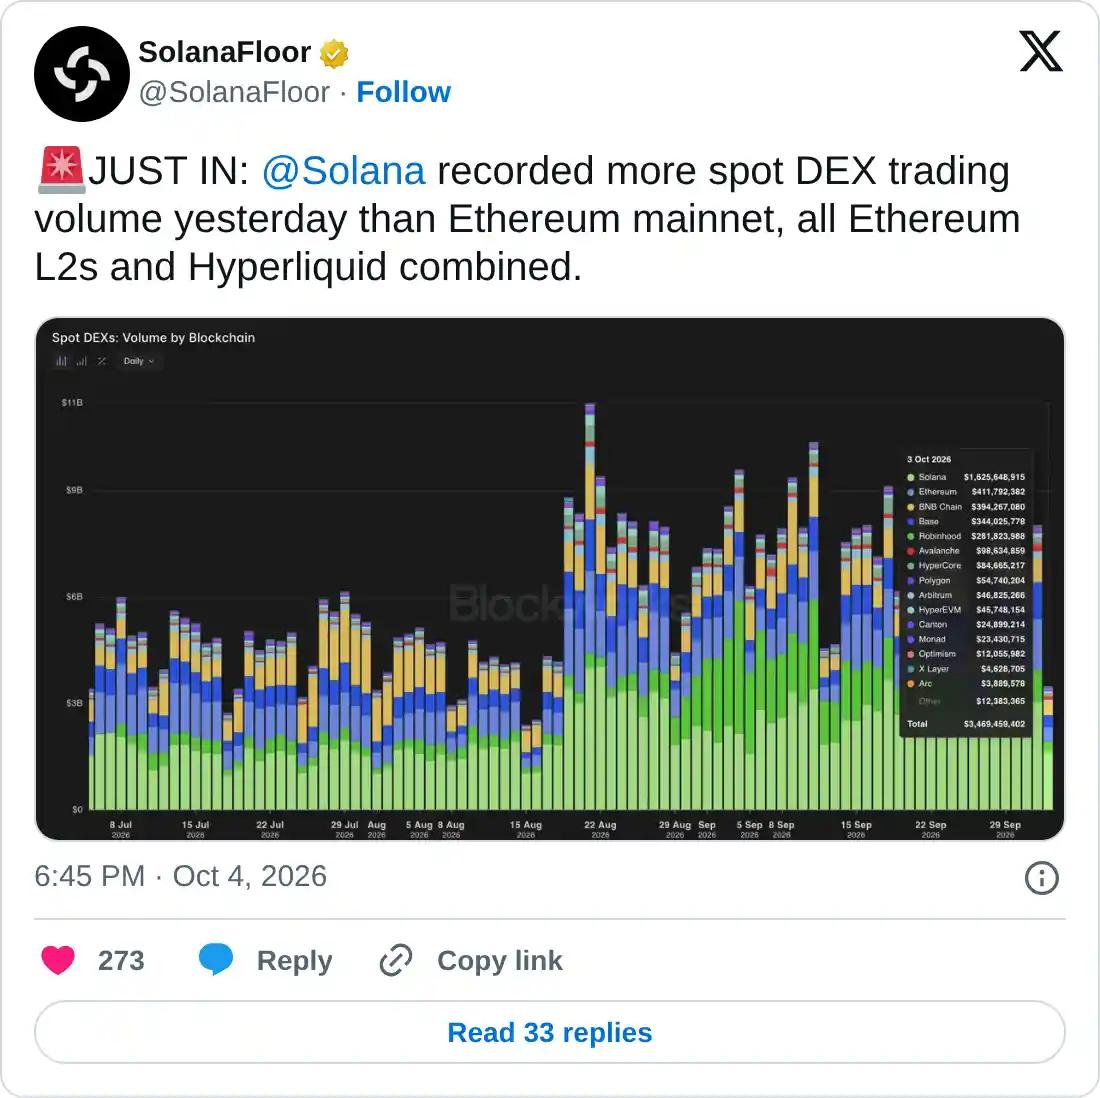
https://x.com/SolanaFloor/status/2106817883032760546

https://x.com/solana/status/2106768200264241173

Technical outlook: Solana holds stable as bullish bias persists

Solana edges lower on Monday after a steady recovery seen over the last four days. SOL holds a constructive bullish bias as price remains above the 50-, 100-, and 200-period Exponential Moving Averages (EMAs) on the four-hour chart around $119.24, $116.43, and $110.44.

From a technical perspective, SOL is positioned well above the upward support trendline at $119.16, keeping the recent recovery phase intact, while an overhead near-term resistance trendline near $123 suggests a triangle pattern.

Momentum on the daily chart is constructive, with a mildly positive Moving Average Convergence Divergence (MACD) and a Relative Strength Index (RSI) near 54, suggesting bullish momentum.

A confirmed breakout of the resistance cluster formed by the trendline near $123 and September's high of $124.95 could further extend the Solana rally. The Fibonacci retracement measured from $95.82 to $124.95 projects the 127.2% extension level at $132.87 as the next bullish target.

Chart Analysis SOL/USDT (Binance)
SOL/USDT four-hour price chart.

On the downside, immediate support is seen at the 50-period EMA near $119.25, reinforced by the reclaimed rising trendline at $119.16 and the 78.6% Fibonacci retracement at $118.71. A break below these would expose deeper cushions at the 100-period EMA around $116.43.

(The technical analysis of this story was written with the help of an AI tool. Know more.)

Disclaimer: For information purposes only. Past performance is not indicative of future results.
placeholder
Weekly Market Outlook: U.S. October CPI Focus and Powell and Fed Officials SpeakInsights – This week, the U.S. will release October CPI data, with inflation expected to face challenges in easing further. Retail sales data will also be closely watched for insights into the economy, guiding the Fed's future policy.
Author  Mitrade
Nov 11, 2024
Insights – This week, the U.S. will release October CPI data, with inflation expected to face challenges in easing further. Retail sales data will also be closely watched for insights into the economy, guiding the Fed's future policy.
placeholder
October hike odds climb toward 60% as Goldman and BofA both flip — what Warsh's "dose of accommodation" really changedRate futures now price roughly 55% to 62% for a 25bp hike at the October 27-28 FOMC, up from about 30% before Chair Warsh's post-meeting framing that the Fed is merely "removing some accommodation." Goldman Sachs has added an October hike to its forecast and Bank of America now sees moves in both October and December. Here is the repricing, the language behind it, and the two data points that decide it.
Author  Irene Q.
Sep 23, Wed
Rate futures now price roughly 55% to 62% for a 25bp hike at the October 27-28 FOMC, up from about 30% before Chair Warsh's post-meeting framing that the Fed is merely "removing some accommodation." Goldman Sachs has added an October hike to its forecast and Bank of America now sees moves in both October and December. Here is the repricing, the language behind it, and the two data points that decide it.
placeholder
【Daily Brief】30-year Treasury tops 5.59%, S&P 500 slips to 7,670 and gold holds $4,180 — PCE lands tonightThe 30-year Treasury yield closed at 5.59%, its highest since June 2002, and the Dow fell 131.59 points to 51,349.92. US consumer confidence dropped to 81.9, a 12-year low, and JOLTS job openings fell to 7.1 million. August PCE and Q3 GDP both land at 8:30am ET tonight.
Author  Suzie
Sep 30, Wed
The 30-year Treasury yield closed at 5.59%, its highest since June 2002, and the Dow fell 131.59 points to 51,349.92. US consumer confidence dropped to 81.9, a 12-year low, and JOLTS job openings fell to 7.1 million. August PCE and Q3 GDP both land at 8:30am ET tonight.
placeholder
Gold falls to near $4,150 as higher Treasury yields, oil prices outweigh softer PCE inflationGold price (XAU/USD) tumbles to near $4,150 during the early Asian session on Thursday, pressured by elevated US Treasury bond yields. Traders await the US September employment data for fresh impetus, which will be released later on Friday. 
Author  FXStreet
Oct 01, Thu
Gold price (XAU/USD) tumbles to near $4,150 during the early Asian session on Thursday, pressured by elevated US Treasury bond yields. Traders await the US September employment data for fresh impetus, which will be released later on Friday. 
placeholder
Euro softens below 1.1250 on France’s fiscal riskThe EUR/USD pair loses momentum to around 1.1245 during the early Asian session on Monday. The Euro (EUR) weakens against the US Dollar (USD) amid fears over France's shaky fiscal trajectory. The US ISM Services Purchasing Managers Index (PMI) report is due later on Monday. 
Author  FXStreet
12 hours ago
The EUR/USD pair loses momentum to around 1.1245 during the early Asian session on Monday. The Euro (EUR) weakens against the US Dollar (USD) amid fears over France's shaky fiscal trajectory. The US ISM Services Purchasing Managers Index (PMI) report is due later on Monday. 
Related Instrument
goTop
quote