

Ethereum Price Forecast: ETH takes a breather at $2,700 as activity, leverage stays calm

Source Fxstreet

Ethereum price today: $2,670

  • Ethereum open interest has remained calm over the past month, indicating reduced leverage participation in the recent uptrend.
  • Network activity has failed to expand despite the price growth, with active addresses and transaction counts declining.
  • ETH approaches the $2,626 support after a rejection at $2,786.

Ethereum (ETH) declines 3% below $2,700 on Wednesday, as the crypto market takes a breather from recent price surges.

Open interest and network activity yet to catch up with price

Open interest, which measures the total worth of unsettled contracts in a derivatives market, has remained calm in ETH terms since the late August short squeeze that pushed prices above $2,000. During the event, OI fell by roughly 700K ETH to 12.9 million ETH before recovering slightly in the first few weeks of September. It declined again last week and has remained near 13 million ETH.
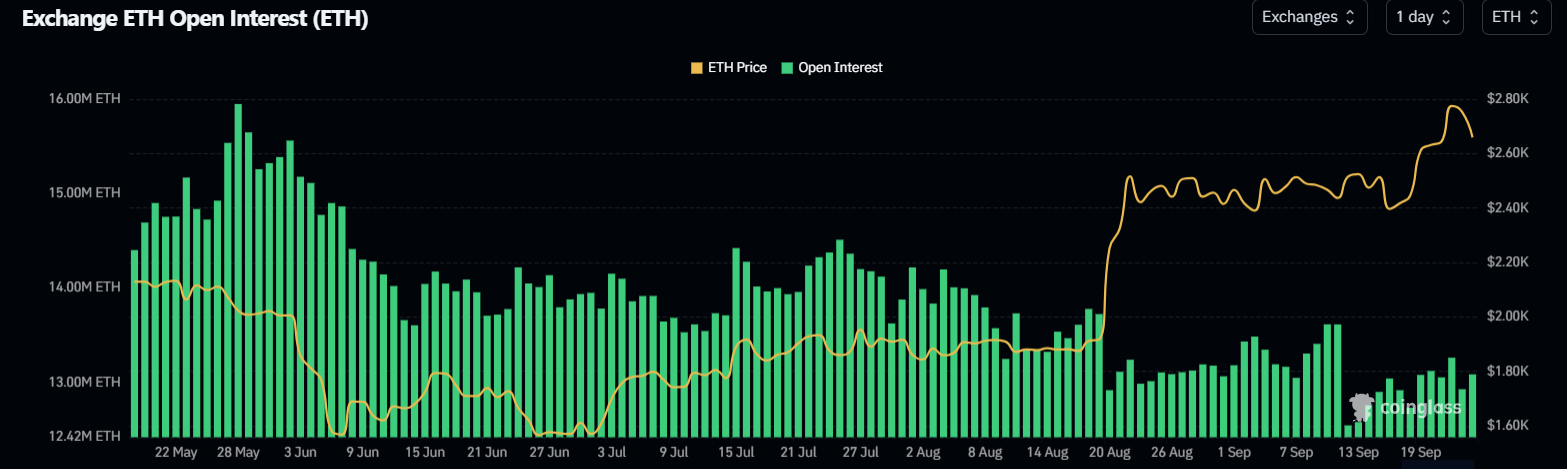
ETH Open Interest. Source: Coinglass

In USD terms, ETH's price has risen 70% since establishing a low at the tail end of June, while open interest grew by only 60% to $34.8 billion over the period.

The reduced participation of leveraged capital in the uptrend so far signals that these investors remain cautious. On the other hand, it also leaves room for further expansion if they eventually increase exposure.

Similarly, network activity has yet to expand despite the recent price growth. Active Addresses, which measures the total number of unique on-chain addresses involved in transactions over a given period, has been flat over the past three months.

Ethereum Active Addresses. Source: CryptoQuant

Total transaction counts on mainnet also declined during the period. Historically, network activity expands during periods of sustainable price uptrend. However, the less pronounced activity could also be attributed to increased Layer 2 capacity following recent Ethereum upgrades.

Ethereum technical outlook: ETH eyes $2,626 support after rejection at $2,786

Ethereum has recorded roughly $119 million in liquidations over the past 24 hours, led by $95.8 million in long liquidations, according to Coinglass data.

​​On the daily chart, ETH continues to hold a constructive bullish bias, with price remaining well above key Exponential Moving Averages (EMAs).

On the downside, immediate support appears at the prior horizontal level around $2,626 after a rejection at $2,786. That level is followed by a short-term demand band clustered near the 20-day EMA at $2,549 and horizontal support at $2,544. Below that, additional cushions are seen at $2,431 and the 50-day EMA at $2,368.

Chart Analysis ETH/USDT (Binance)
ETH/USDT daily chart

On the topside, ETH faces initial resistance at $2,786, with subsequent barriers at $2,894 and $3,177 that would need to be cleared to extend the current uptrend.

Momentum indicators, the Relative Strength Index (RSI) and Stochastic Oscillator (Stoch), are cooling after a brief extension into overbought territory.

(The technical analysis of this story was written with the help of an AI tool. Know more.)

Disclaimer: For information purposes only. Past performance is not indicative of future results.
placeholder
WTI (USOIL) Is down 2.03% on Sep 25: Here Is WhyWTI (USOIL) is down 2.03% at Sep 24 22:20(UTC+0), now at $92.517, with a 7-day down of 3.63%.What is driving WTI (USOIL)’s stock price down today?The drop in WTI crude oil prices was primarily driven by
Author  TradingKey
18 hours ago
WTI (USOIL) is down 2.03% at Sep 24 22:20(UTC+0), now at $92.517, with a 7-day down of 3.63%.What is driving WTI (USOIL)’s stock price down today?The drop in WTI crude oil prices was primarily driven by
placeholder
Silver Price Forecast: XAG/USD remains steady near $64.00 as oil prices easeSilver price (XAG/USD) inches higher after two days of losses, trading around $63.90 per troy ounce during Asian hours on Friday. Non-yielding Silver is finding underlying support as inflation concerns ease following a pullback in crude oil prices.
Author  FXStreet
20 hours ago
Silver price (XAG/USD) inches higher after two days of losses, trading around $63.90 per troy ounce during Asian hours on Friday. Non-yielding Silver is finding underlying support as inflation concerns ease following a pullback in crude oil prices.
placeholder
Gold Price Forecast: Gold Drops Below $4,300, Will It Continue to Fall? As of the European session on September 24, gold prices (XAUUSD) extended their correction, dipping below $4,300 intraday to hit a low of $4,262.45. After previously rebounding close to $
Author  TradingKey
Yesterday 09: 57
As of the European session on September 24, gold prices (XAUUSD) extended their correction, dipping below $4,300 intraday to hit a low of $4,262.45. After previously rebounding close to $
placeholder
Yen touches 158.37 as Tokyo reopens, then slips back — ¥15.4 trillion of intervention and the 200-day line stand between here and 160USD/JPY reached 158.37 overnight, its highest since early September, then eased to 157.88 as Japanese markets reopened after a three-day holiday. The Ministry of Finance has spent ¥15.4 trillion defending the yen since late July and the BOJ ran a rate check on September 18. The 200-day average sits at 158.43.
Author  Irene Q.
Yesterday 06: 59
USD/JPY reached 158.37 overnight, its highest since early September, then eased to 157.88 as Japanese markets reopened after a three-day holiday. The Ministry of Finance has spent ¥15.4 trillion defending the yen since late July and the BOJ ran a rate check on September 18. The 200-day average sits at 158.43.
placeholder
US input costs rose at the fastest pace in four years — the September flash PMI beat is an inflation story, not a growth storyUS September flash PMIs came in far above expectations, with the composite at 58.4, a five-year high. But the detail that moved markets was input cost inflation at its fastest since October 2022, driven by fuel, transport and supply shortages. Brent is back above $100 and the 10-year Treasury yield has hit its highest since 2007.
Author  Suzie
Yesterday 06: 46
US September flash PMIs came in far above expectations, with the composite at 58.4, a five-year high. But the detail that moved markets was input cost inflation at its fastest since October 2022, driven by fuel, transport and supply shortages. Brent is back above $100 and the 10-year Treasury yield has hit its highest since 2007.
Related Instrument
goTop
quote