

Pi Network Price Forecast: PI extends gains as mainnet blocks confirm Protocol v27 upgrade

Source Fxstreet
  • Pi Network ticks higher on Wednesday, extending its mild recovery above $0.090.
  • Pi Block Explorer data shows that new blocks on the Pi mainnet are added with the v27 protocol upgrade.
  • Momentum indicators remain neutral as price struggles to reclaim the 50-day EMA at $0.0923.

Pi Network (PI) is trading in the green above $0.090 on Wednesday, maintaining a mild constructive tone so far this week. Pi Block Explorer data suggests a potential mainnet rollout of the v27 protocol upgrade. Pi Network must reclaim the $0.1000 psychological threshold to sustain its upward trend.

Pi Network’s v27 upgrade rolls out to the mainnet

Pi Network recently completed the final testnet step for Protocol v27, making it ready for mainnet deployment. The new upgrade will introduce more flexible and secure smart-contract authentication. At the same time, the Pi Testnet has begun operating on Protocol v28, testing a higher-version environment than Mainnet.

The protocol upgrade could lift retail sentiment, improving recovery odds as capital rotates into altcoins across the broader cryptocurrency market.
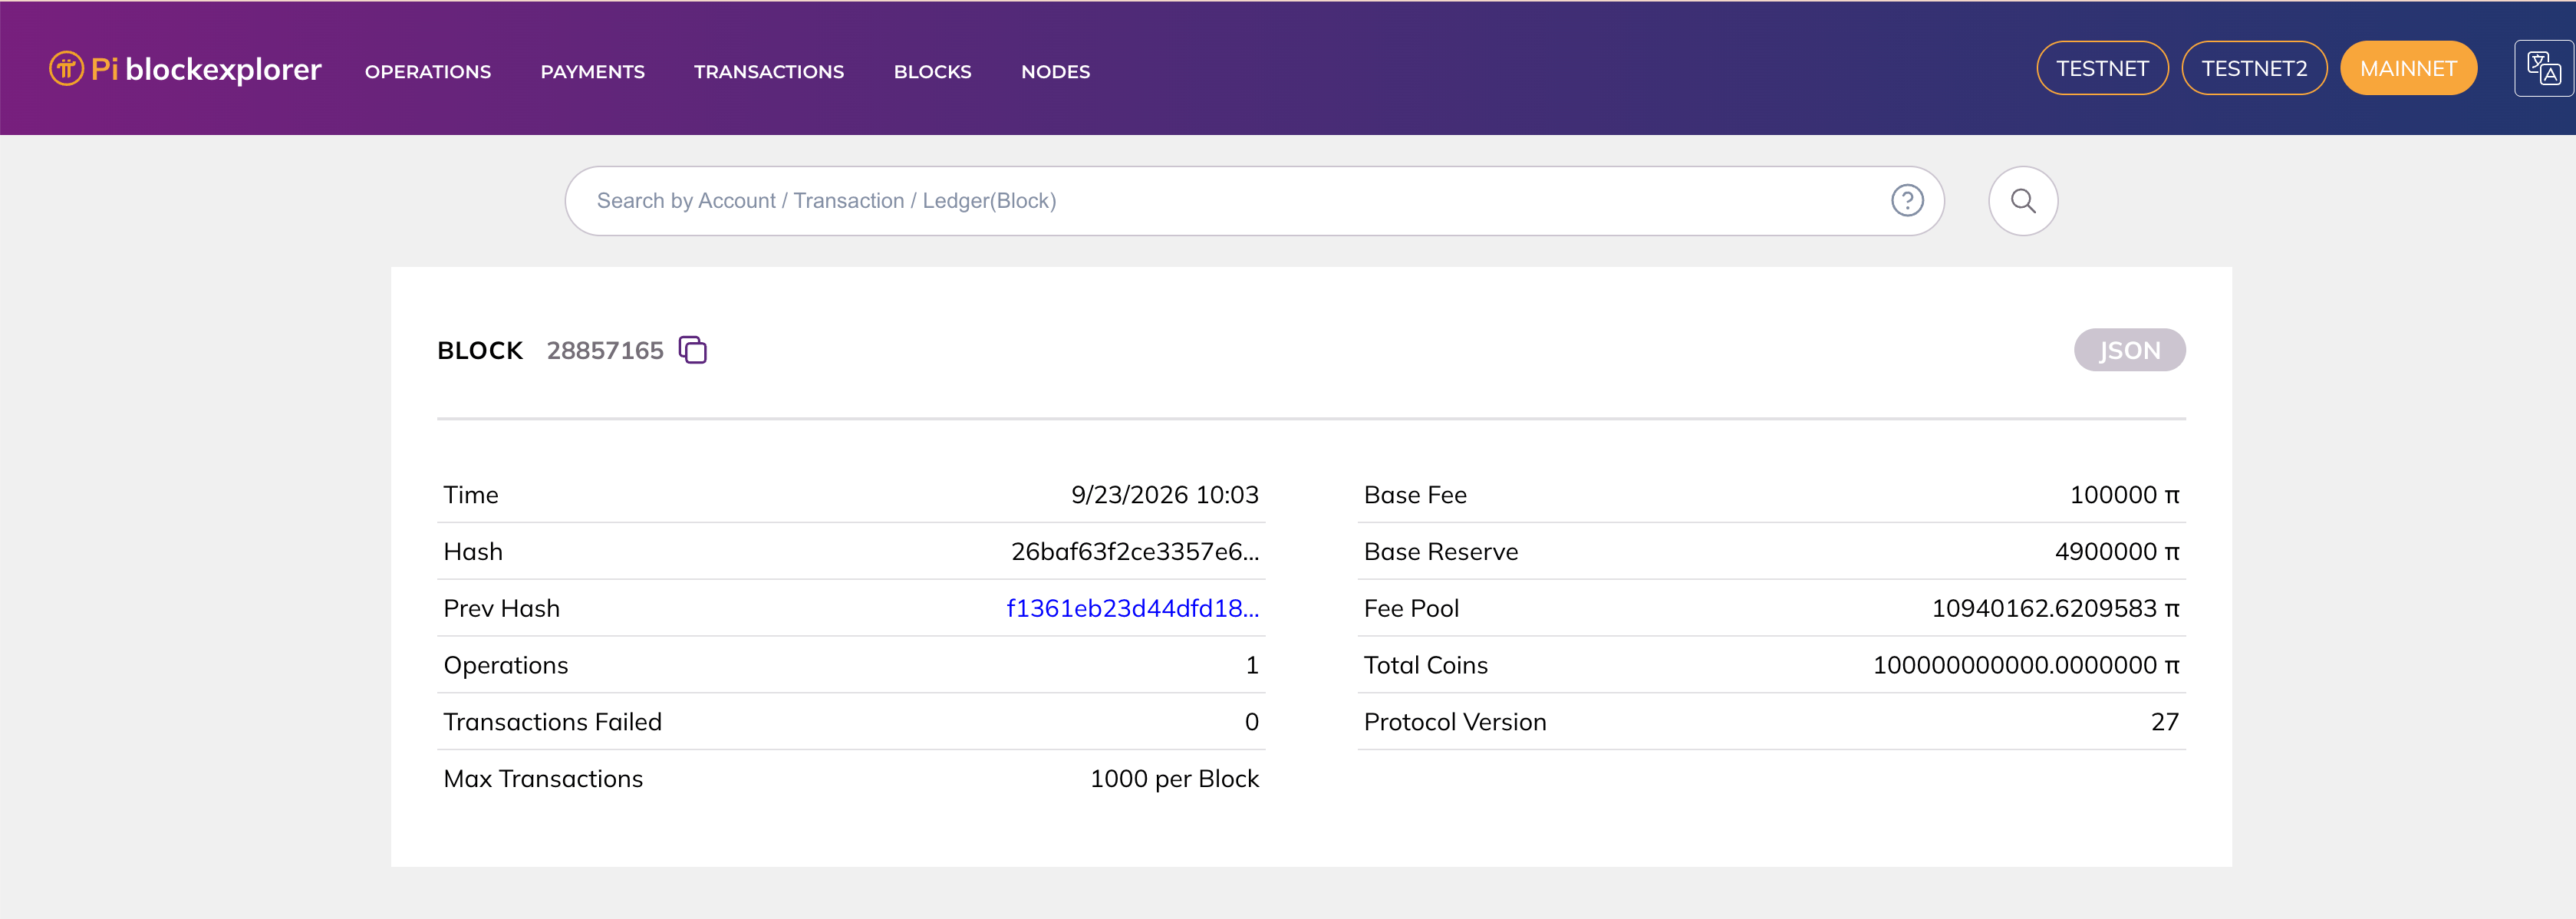
Pi Network block data. Source: Pi Block Explorer

Technical outlook: Pi Network remains capped below its 50-day EMA

Pi Network trades around $0.0913 at press time on Wednesday, extending a recovery from the September 16 low around $0.0801. Still, PI remains capped by the short-term 50-day Exponential Moving Average (EMA) at $0.0923 and well under the 100-day and 200-day EMAs at $0.1022 and $0.1310, respectively, which keeps the near-term bias bearish.

The Relative Strength Index (RSI) hovering just above 51 hints at stabilizing momentum, but the Moving Average Convergence Divergence (MACD) stays marginally below the zero and signal lines, with a shallow negative reading, suggesting upside attempts are vulnerable.

On the topside, initial resistance is seen at the 50-day EMA near $0.0923, followed by the 100-day EMA at $0.1022, reinforced by the 50% retracement of the broader decline from $0.1341 to $0.0704 at $0.1049, where sellers could reassert control if the recovery extends.

On the downside, the first support appears at the 23.6% Fibonacci retracement level around $0.0866, ahead of the structural Fibonacci anchor near $0.0704, which marks a more significant floor if bearish pressure resumes.

Chart Analysis PI/USD (baha Crypto)
PI/USD daily price chart.

(The technical analysis of this story was written with the help of an AI tool. Know more.)

Disclaimer: For information purposes only. Past performance is not indicative of future results.
placeholder
WTI (USOIL) Is down 2.03% on Sep 25: Here Is WhyWTI (USOIL) is down 2.03% at Sep 24 22:20(UTC+0), now at $92.517, with a 7-day down of 3.63%.What is driving WTI (USOIL)’s stock price down today?The drop in WTI crude oil prices was primarily driven by
Author  TradingKey
16 hours ago
WTI (USOIL) is down 2.03% at Sep 24 22:20(UTC+0), now at $92.517, with a 7-day down of 3.63%.What is driving WTI (USOIL)’s stock price down today?The drop in WTI crude oil prices was primarily driven by
placeholder
Silver Price Forecast: XAG/USD remains steady near $64.00 as oil prices easeSilver price (XAG/USD) inches higher after two days of losses, trading around $63.90 per troy ounce during Asian hours on Friday. Non-yielding Silver is finding underlying support as inflation concerns ease following a pullback in crude oil prices.
Author  FXStreet
18 hours ago
Silver price (XAG/USD) inches higher after two days of losses, trading around $63.90 per troy ounce during Asian hours on Friday. Non-yielding Silver is finding underlying support as inflation concerns ease following a pullback in crude oil prices.
placeholder
Gold Price Forecast: Gold Drops Below $4,300, Will It Continue to Fall? As of the European session on September 24, gold prices (XAUUSD) extended their correction, dipping below $4,300 intraday to hit a low of $4,262.45. After previously rebounding close to $
Author  TradingKey
Yesterday 09: 57
As of the European session on September 24, gold prices (XAUUSD) extended their correction, dipping below $4,300 intraday to hit a low of $4,262.45. After previously rebounding close to $
placeholder
Yen touches 158.37 as Tokyo reopens, then slips back — ¥15.4 trillion of intervention and the 200-day line stand between here and 160USD/JPY reached 158.37 overnight, its highest since early September, then eased to 157.88 as Japanese markets reopened after a three-day holiday. The Ministry of Finance has spent ¥15.4 trillion defending the yen since late July and the BOJ ran a rate check on September 18. The 200-day average sits at 158.43.
Author  Irene Q.
Yesterday 06: 59
USD/JPY reached 158.37 overnight, its highest since early September, then eased to 157.88 as Japanese markets reopened after a three-day holiday. The Ministry of Finance has spent ¥15.4 trillion defending the yen since late July and the BOJ ran a rate check on September 18. The 200-day average sits at 158.43.
placeholder
US input costs rose at the fastest pace in four years — the September flash PMI beat is an inflation story, not a growth storyUS September flash PMIs came in far above expectations, with the composite at 58.4, a five-year high. But the detail that moved markets was input cost inflation at its fastest since October 2022, driven by fuel, transport and supply shortages. Brent is back above $100 and the 10-year Treasury yield has hit its highest since 2007.
Author  Suzie
Yesterday 06: 46
US September flash PMIs came in far above expectations, with the composite at 58.4, a five-year high. But the detail that moved markets was input cost inflation at its fastest since October 2022, driven by fuel, transport and supply shortages. Brent is back above $100 and the 10-year Treasury yield has hit its highest since 2007.
goTop
quote