

Pi Network Price Forecast: PI extends losses below $1 billion market capitalization

Source Fxstreet
  • Pi Network hovers around $0.083 on Thursday after facing 7% losses two days in a row.
  • Broader market uncertainty linked to the US Fed rate hike and the failure of the CLARITY Act to advance weighs on Pi Network.
  • The technical outlook for PI is bearish, with the $0.0819 support level in focus.

Pi Network (PI) faces intense downside pressure, edging lower on Thursday after two consecutive days of 7% losses. The broader market uncertainty weighs on the Pi Core Team’s efforts to boost ecosystem expansion through network upgrades. The technical outlook for PI is bearish, with bears watching for a break below the $0.0819 support level. 

Pi Network market capitalization drops below $1 billion amid rate hike, CLARITY Act delay

The CLARITY Act failed to advance to the US Senate floor for cloture voting on Tuesday, followed by the US Federal Reserve (Fed) raising interest rates by 25 bps on Wednesday, posing regulatory and macroeconomic challenges for crypto investors. These challenges overshadow the recent SoloHost Apps launched by the Pi Core Team to boost development and ecosystem activity.

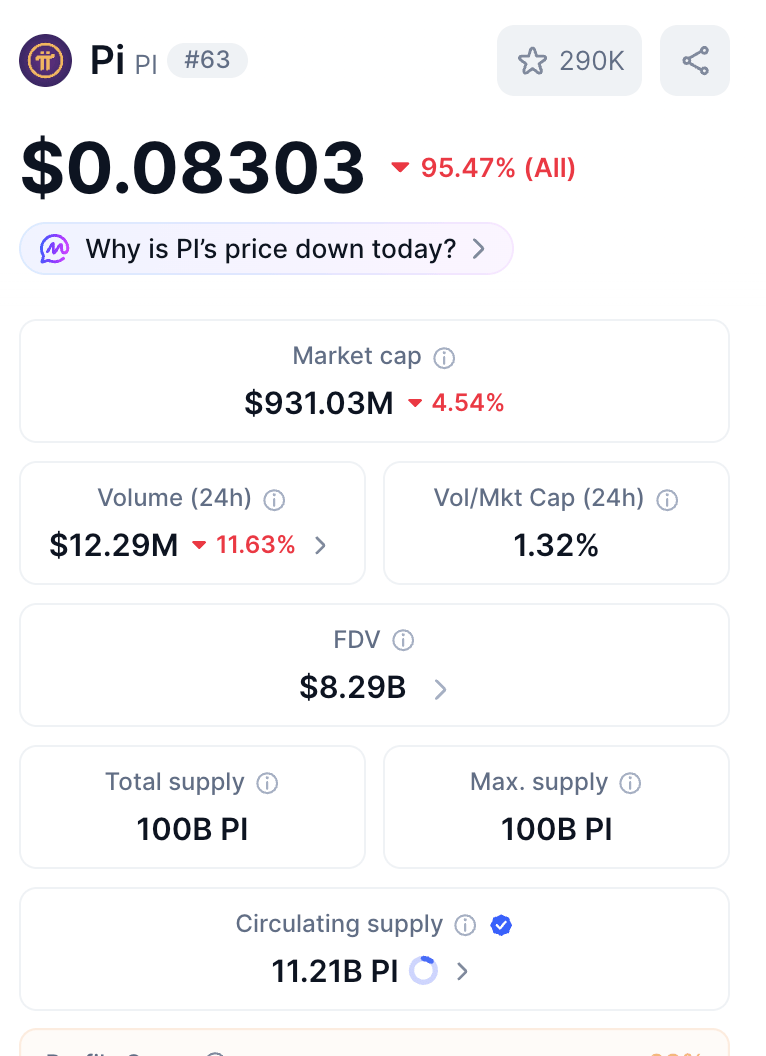
The broader cryptocurrency market maintains a risk-on sentiment, with the Fear and Greed Index holding flat at 63, above the neutral zone, on Thursday. However, high-risk, low-valuation altcoins such as Pi Network have seen heavy selling over the last two days, with declines exceeding 14%. CoinMarketCap data shows the PI token market cap dropped below $1 billion on Wednesday, reflecting reduced investor confidence.
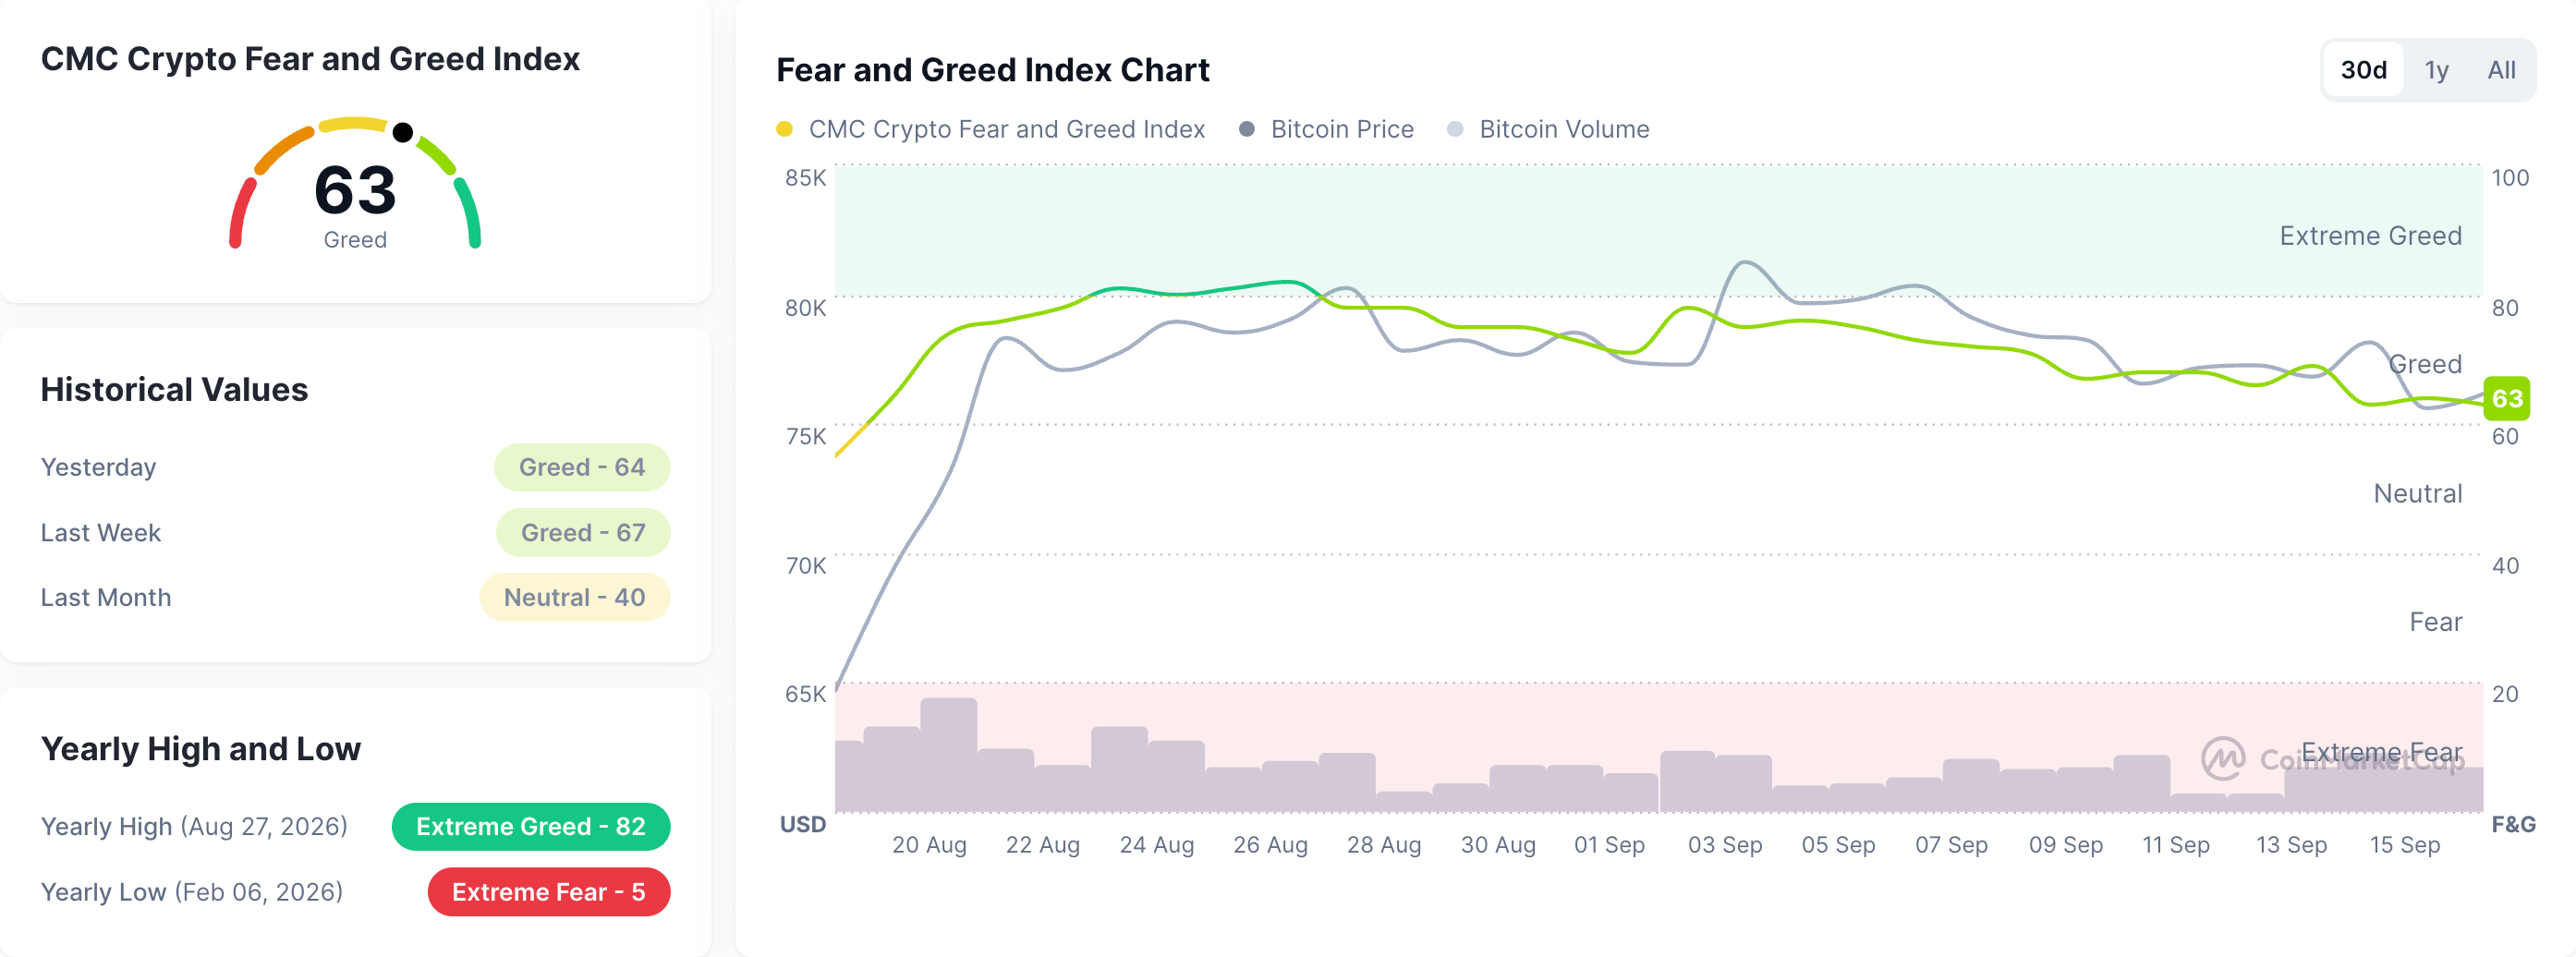
Fear and Greed Index. Source: CoinMarketCap
Pi Network metrics. Source: CoinMarketCap

Technical outlook: Pi Network gains bearish momentum

Pi Network trades in the red for the third consecutive day on Thursday, extending its near-term bearish bias. PI token breached below its 50-day Exponential Moving Average (EMA) around $0.0936 on Wednesday, reinforcing the downside structure with the overhead 100- and 200-day EMAs at $0.1037 and $0.1284.

Momentum reinforces this weak tone, with the Relative Strength Index (RSI) slipping toward the oversold area near 34, while the Moving Average Convergence Divergence (MACD) has crossed below zero and its signal line, with a negative and expanding histogram hinting at persistent selling pressure.

Looking down, the immediate support aligns with the 23.6% Fibonacci retracement level at $0.0819, measured from $0.1341 to $0.0704. A confirmed breakout below this level could target the $0.0704 swing low, threatening a potential new all-time low if selling pressure sustains.

PI/USDT daily price chart.

On the upside, the 50-day EMA at $0.0936 serves as the immediate bullish target in case of a rebound. Beyond that, the 50% retracement level at $0.0971 and the 100-day EMA at $0.1036 could act as the next resistance levels.

(The technical analysis of this story was written with the help of an AI tool. Know more.)

Disclaimer: For information purposes only. Past performance is not indicative of future results.
placeholder
Fed hike odds near 90% into Wednesday's decision — how to trade the dollar, gold and the S&P 500A 0.3% monthly core CPI print has lifted the market-implied probability of a 25bp Fed hike on 16 September to roughly 86.5% ~ 90%, which would be the first increase since July 2023. Here is the decision timeline, the pricing versus the forecasts, both scenarios, and the key levels for the dollar, gold and the S&P 500.
Author  Suzie
Sep 14, Mon
A 0.3% monthly core CPI print has lifted the market-implied probability of a 25bp Fed hike on 16 September to roughly 86.5% ~ 90%, which would be the first increase since July 2023. Here is the decision timeline, the pricing versus the forecasts, both scenarios, and the key levels for the dollar, gold and the S&P 500.
placeholder
【Daily Brief】10-year Treasury yield briefly tops 5%, S&P 500 slips to 7,602 and the dollar firms at 99.3 as the Fed's decision eve beginsThe 10-year Treasury yield touched 5.014% on Monday — its first print above 5% since October 2023 — while the S&P 500 closed 0.48% lower at 7,619.98 and the dollar index firmed to 99.3. Here is the full market wrap ahead of Wednesday's FOMC decision, the dot plot and the August retail sales report, plus today's CLARITY Act Senate vote.
Author  Irene Q.
Sep 15, Tue
The 10-year Treasury yield touched 5.014% on Monday — its first print above 5% since October 2023 — while the S&P 500 closed 0.48% lower at 7,619.98 and the dollar index firmed to 99.3. Here is the full market wrap ahead of Wednesday's FOMC decision, the dot plot and the August retail sales report, plus today's CLARITY Act Senate vote.
placeholder
Silver breaks $64 as precious metals rebound — can gold hold the $4,280 line into the Fed decision?Silver has climbed back above $64 an ounce for the first time this week, leading a broad rebound across precious metals hours before the Federal Reserve delivers what is expected to be its first rate hike since 2023. Spot silver was last at $64.64, up 1.49% on the day, while gold reclaimed $4,300 and platinum and palladium both advanced. The question now is whether the bounce is a genuine turn — or a pause before the Fed's dot plot decides the next move.
Author  Suzie
23 hours ago
Silver has climbed back above $64 an ounce for the first time this week, leading a broad rebound across precious metals hours before the Federal Reserve delivers what is expected to be its first rate hike since 2023. Spot silver was last at $64.64, up 1.49% on the day, while gold reclaimed $4,300 and platinum and palladium both advanced. The question now is whether the bounce is a genuine turn — or a pause before the Fed's dot plot decides the next move.
placeholder
Bitcoin falls below $75,000 as the CLARITY Act fails in the Senate — what the vote means for cryptoThe US Senate blocked the Digital Asset Market CLARITY Act in a 49-50 procedural vote, sending Bitcoin briefly below $75,000 — its biggest one-day drop since June. Ethereum fell more than 8%, Coinbase slid 10% and $75 billion of crypto market value evaporated. Here is what the vote was, why it failed, and the levels that matter now.
Author  Suzie
23 hours ago
The US Senate blocked the Digital Asset Market CLARITY Act in a 49-50 procedural vote, sending Bitcoin briefly below $75,000 — its biggest one-day drop since June. Ethereum fell more than 8%, Coinbase slid 10% and $75 billion of crypto market value evaporated. Here is what the vote was, why it failed, and the levels that matter now.
placeholder
Dow drops 631 points as the Fed hikes — but futures are rebounding: what's next for US stocks?The Dow fell 631 points and the S&P 500 closed below 7,600 after the Fed hiked rates for the first time since 2023, with the dot plot showing 16 of 18 officials expect more tightening. Asia-session futures are already recovering — here are the levels and analyst views that decide whether 7,500 holds.
Author  Irene Q.
5 hours ago
The Dow fell 631 points and the S&P 500 closed below 7,600 after the Fed hiked rates for the first time since 2023, with the dot plot showing 16 of 18 officials expect more tightening. Asia-session futures are already recovering — here are the levels and analyst views that decide whether 7,500 holds.
goTop
quote