

Solana Price Forecast: SOL eyes $100 breakout amid governance voting, renewed ETF inflows

Source Fxstreet
  • Solana edges lower on Monday, holding above $90 after a 27% rise the previous week.
  • SOL-focused ETFs recorded $28.34 million in inflows last week, the highest since mid-May, indicating renewed institutional demand.
  • Solana validator governance has started voting on SGP 1, SGP 2, and SGP 3, which include doubling the disinflation rate to -30%.

Solana (SOL) edges lower to $94 on Monday, following a 27% rebound last week to a two-month high. SOL-focused Exchange Traded Funds (ETFs) recorded four consecutive days of inflows last week, totaling $28.34 million, suggesting renewed institutional buying. Validator voting on multiple proposals started on Monday, which includes doubling the disinflation rate to 30%. 

Solana validator voting begins

Solana validators have begun voting on SGP 1, SGP 2, and SGP 3 proposals, with voting ending Thursday. The SGP 1 protocol addresses the ratification of the Solana Constitution to govern Solana’s network-level decision-making. SGP 2 proposes reducing the inflation rate by increasing the disinflation rate to -15% to -30%. Finally, SGP 3 plans to introduce a fixed base inclusion fee paid to the block leader and a resource fee with a requested transaction cost, which will be burned. 

Taken together, the proposals will restructure on-chain decision-making and reduce pressure on available supply. 
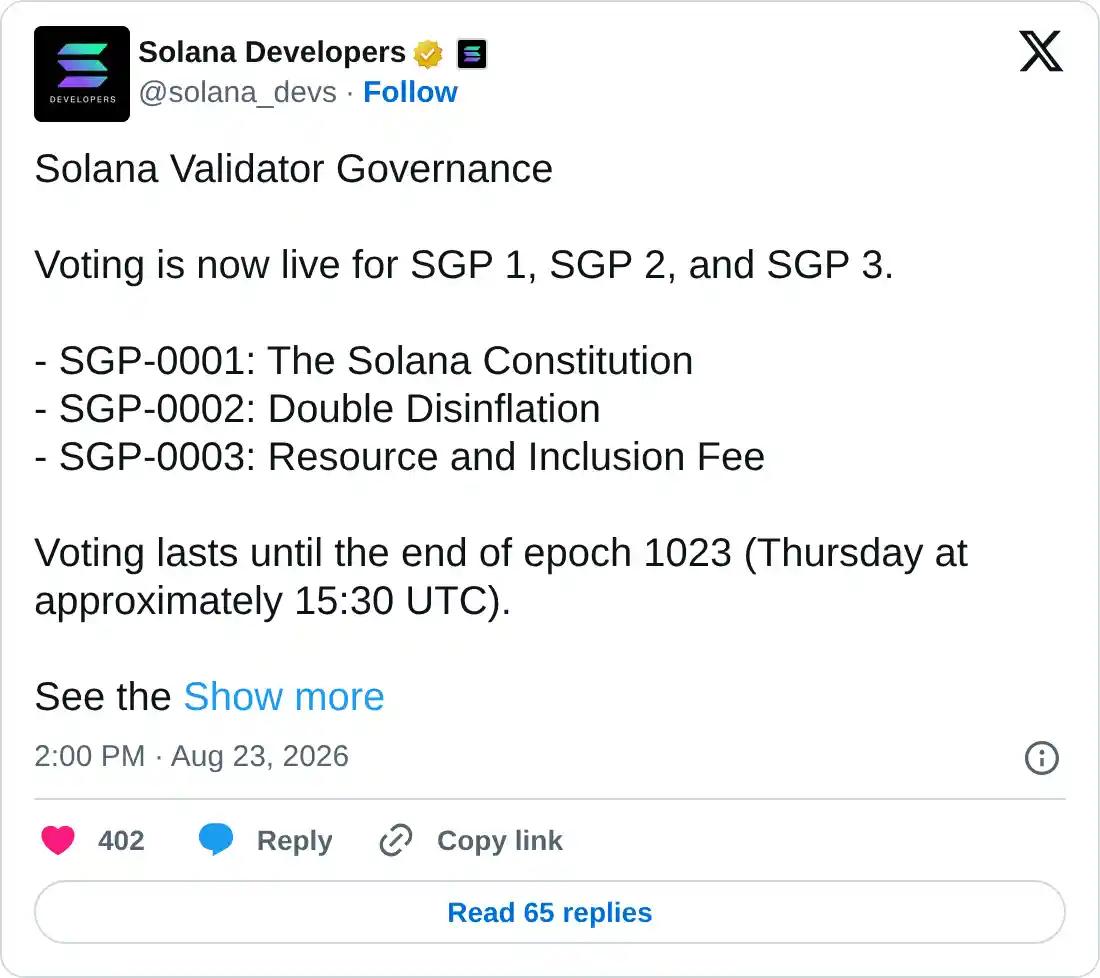
https://x.com/solana_devs/status/2091525961925698024

Solana ETFs regain strength

Solana regains institutional demand. SoSoValue data shows the SOL-focused ETFs recorded $28.34 million in inflows last week, the highest over the last two months. Typically, renewed buying from institutional investors implies a bullish trend reversal. 
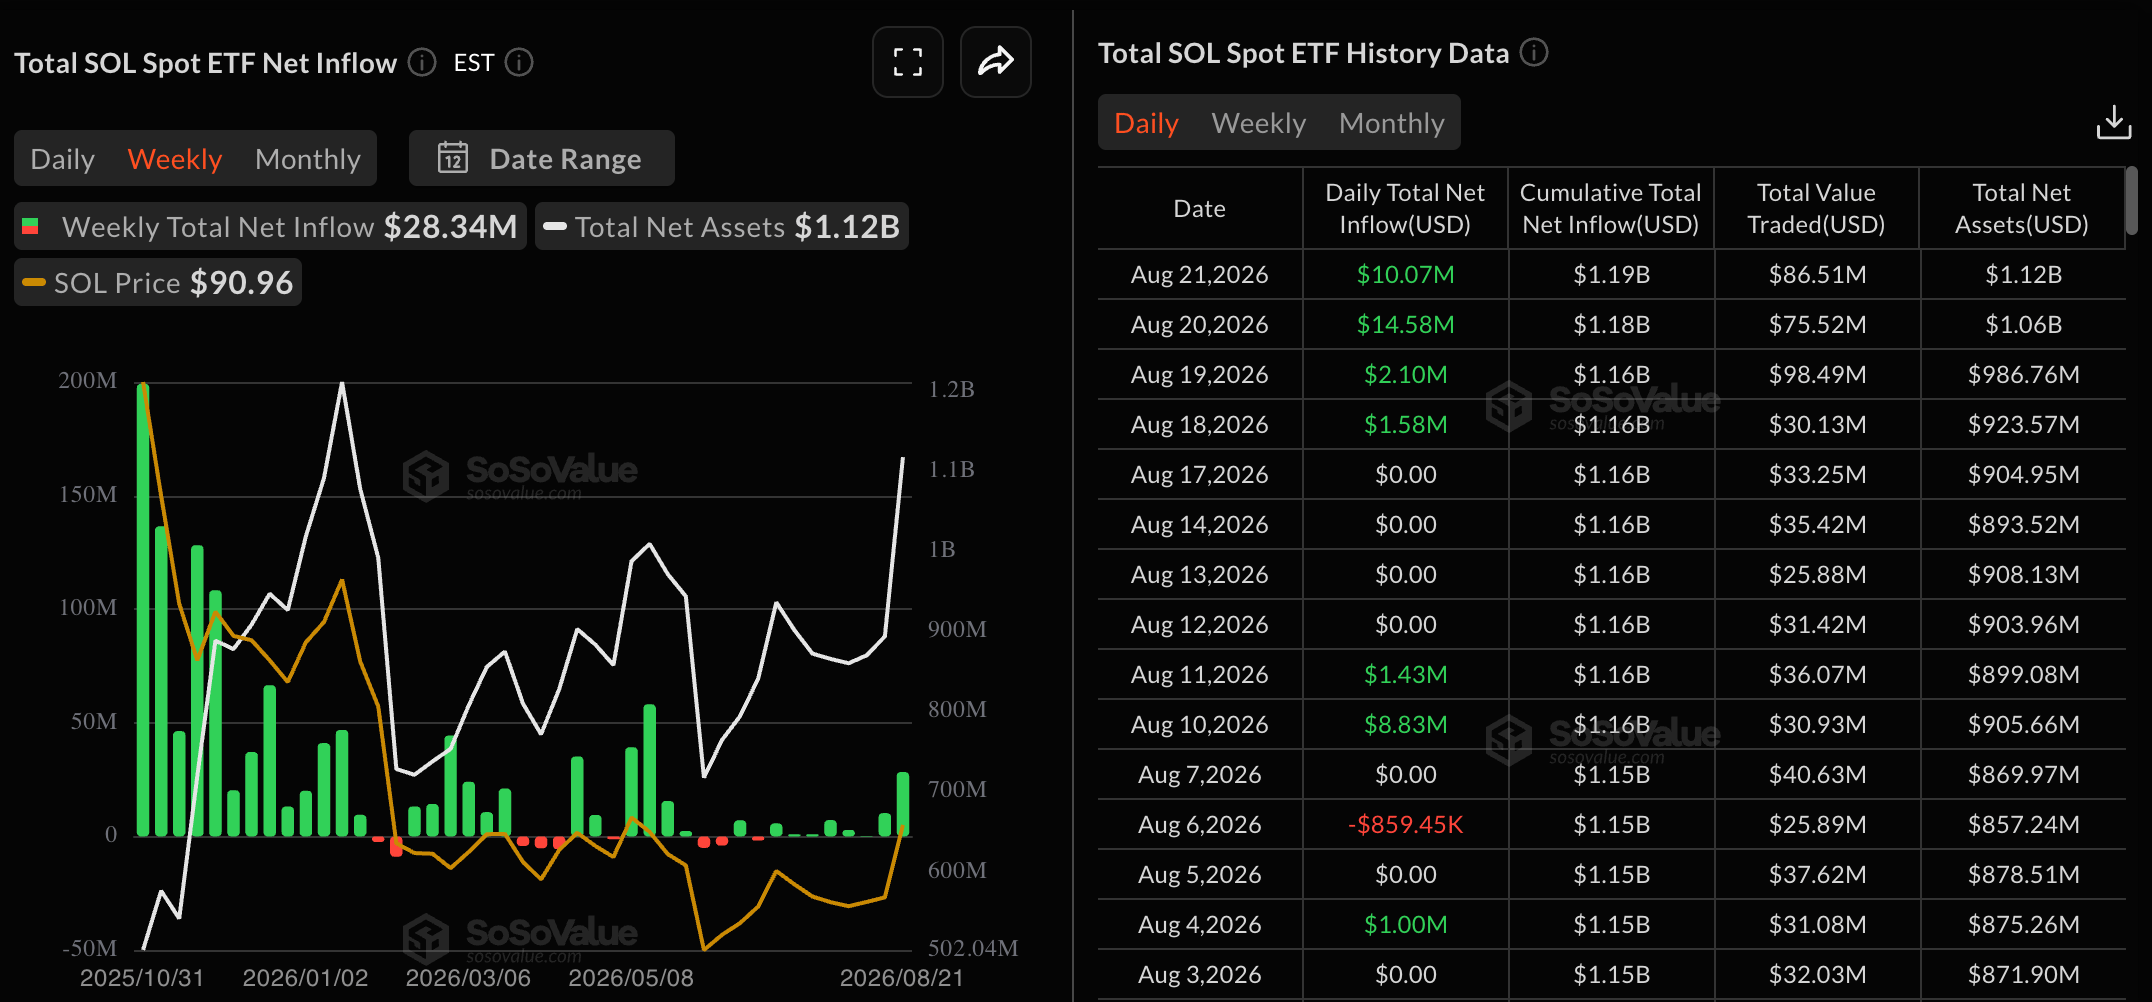
SOL ETFs data. Source: Sosovalue

Technical outlook: Will SOL price cross above $100?

Solana trades around $94 on Monday, holding a bullish near-term bias above both the 50-day Exponential Moving Average (EMA) at $79.04 and the 200-day EMA at $92.67. SOL price remains capped below the $100 psychological level and the May 11 high of $98.41.

For a sustained recovery, SOL should confirm a decisive close above the $100 mark. This could open the path toward the 127.2% Fibonacci extension level of the $98.41 to $60.13 downswing at $112.52.

Momentum stays strong, with the Relative Strength Index (RSI) hovering in overbought territory near 79 on the daily chart. At the same time, the Moving Average Convergence Divergence (MACD) shows a steady upward trend with a positive histogram, suggesting that buying pressure remains dominant.

Chart Analysis SOL/USDT (Binance)
SOL/USDT daily price chart.

On the downside, initial support is seen at the 200-day EMA around $92.67, followed by the 78.6% retracement near $88.56. Deeper declines would expose the 50-day EMA at $79.04 and the 50% retracement at $76.92.

(The technical analysis of this story was written with the help of an AI tool. Know more.)

Disclaimer: For information purposes only. Past performance is not indicative of future results.
placeholder
Natural Gas sinks to pivotal level as China’s demand slumpsNatural Gas price (XNG/USD) edges lower and sinks to $2.56 on Monday, extending its losing streak for the fifth day in a row. The move comes on the back of China cutting its Liquified Natural Gas (LNG) imports after prices rose above $3.0 in June. It
Author  FXStreet
Jul 01, 2024
Natural Gas price (XNG/USD) edges lower and sinks to $2.56 on Monday, extending its losing streak for the fifth day in a row. The move comes on the back of China cutting its Liquified Natural Gas (LNG) imports after prices rose above $3.0 in June. It
placeholder
Markets in 2026: Will gold, Bitcoin, and the U.S. dollar make history again? — These are how leading institutions thinkAfter a turbulent 2025, what lies ahead for commodities, forex, and cryptocurrency markets in 2026?
Author  Insights
Dec 25, 2025
After a turbulent 2025, what lies ahead for commodities, forex, and cryptocurrency markets in 2026?
placeholder
Financial Markets 2026: Volatility Catalysts in Gold, Silver, Oil, and Blue-Chip Stocks—A CFD Trader's OutlookGet a comprehensive financial market 2026 outlook exploring key economic drivers, volatility catalysts in gold, oil and stocks, and what the evolving economic outlook means for cfd trading strategies and risk management on global markets.
Author  Rachel Weiss
May 15, Fri
Get a comprehensive financial market 2026 outlook exploring key economic drivers, volatility catalysts in gold, oil and stocks, and what the evolving economic outlook means for cfd trading strategies and risk management on global markets.
placeholder
Gold Price Forecast: US Treasury Yield Slump Pushes Gold Above $4,500, Will Gold Keep Rising?As of the Asian session on August 20, gold prices (XAUUSD) surged again today after breaking above $4,500 on Wednesday, reaching a nearly two-month high of $4,527.12 before pulling back i
Author  TradingKey
Aug 20, Thu
As of the Asian session on August 20, gold prices (XAUUSD) surged again today after breaking above $4,500 on Wednesday, reaching a nearly two-month high of $4,527.12 before pulling back i
placeholder
Crypto Today: Bitcoin, Ethereum, XRP bulls accelerate rally amid rising ETF inflowsThe cryptocurrency market remains bullish on Friday, led by Bitcoin’s (BTC) surge above $77,000. Altcoins, including Ethereum (ETH) and Ripple (XRP), mirror BTC’s positive outlook, trading near $2,400 and $1.35, respectively.
Author  FXStreet
Aug 21, Fri
The cryptocurrency market remains bullish on Friday, led by Bitcoin’s (BTC) surge above $77,000. Altcoins, including Ethereum (ETH) and Ripple (XRP), mirror BTC’s positive outlook, trading near $2,400 and $1.35, respectively.
Related Instrument
goTop
quote