


WTI Oil Price Forecast: Buyers eye breakout above $100 as upside pressure builds
- WTI Oil climbs toward $100 amid persistent Middle East supply risks.
- The daily chart favours buyers as WTI stays above the 50-day, 100-day and 200-day SMAs.
- A decisive move above $100 could pave the way for further gains toward $105.
West Texas Intermediate (WTI) Oil rebounds on Thursday as ongoing tensions in the Middle East keep supply risks elevated, maintaining a significant geopolitical risk premium in energy markets. At the time of writing, WTI trades around $99, hovering near five-week highs and up 1.40% on the day.
The latest developments in the Middle East have added to fears of further disruptions to Oil supplies.
According to The New York Times, the United States (US) and Israel are considering renewed strikes on Iran after the US midterm elections, with the country's energy facilities among the potential targets.
Meanwhile, the conflict between Saudi Arabia and the Houthis shows no signs of easing, following reports of attacks on the Shaybah oil field and King Fahd International Airport. The situation has also prompted the US State Department to order non-emergency government staff and their families to leave Saudi Arabia.
Shipping through the Strait of Hormuz remains another major concern. Iran's Islamic Revolutionary Guard Corps (IRGC) claimed that its navy targeted four vessels involved in Oil transfers in the Gulf. Separately, three other ships reportedly caught fire after striking mines near the Strait.
Despite mounting tensions, Middle East Oil exports have recovered to pre-war levels as producers increasingly rely on alternative shipping routes to bypass the Strait of Hormuz. According to data from Kpler cited by the Financial Times, Oil shipments from Gulf producers excluding Iran averaged 24.6 million barrels per day in the week ending October 18, above the pre-war average of 23.3 million barrels per day.
Technical analysis
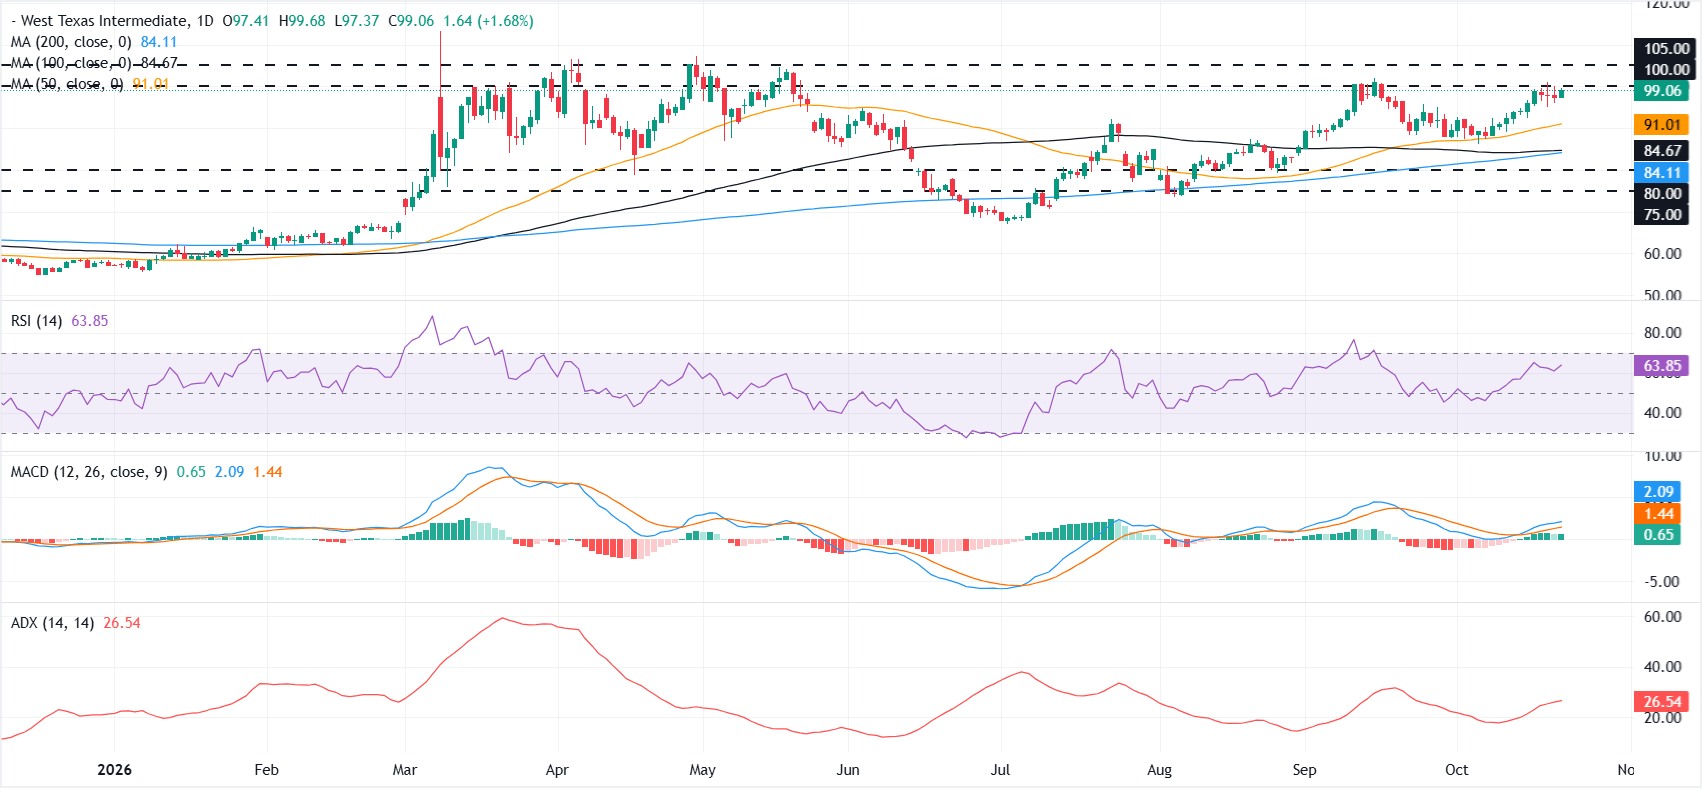
On the daily chart, WTI US Oil maintains a bullish near-term bias as it holds well above the 50-day Simple Moving Average (SMA) at roughly $91 and the longer-term 100-day and 200-day SMAs clustered just below $85. The Relative Strength Index (RSI) around 64 stays in positive territory without yet reaching overbought extremes, while the Moving Average Convergence Divergence (MACD) histogram remains positive, together suggesting firm upside momentum backed by a moderately strong trend signaled by an Average Directional Index (ADX) near 27.
On the topside, immediate resistance is seen at the psychological $100.00 handle, with a subsequent barrier at $105 if bulls extend the advance. On the downside, initial support is implied by today’s opening region near $98.98, with stronger structural backing at the 50-day SMA around $91.01, ahead of the deeper medium-term support band formed by the 100-day SMA at $84.67, the 200-day SMA at $84.11, and the horizontal levels at $80.00 and $75.00.
(The technical analysis of this story was written with the help of an AI tool. Know more.)
WTI Oil FAQs
WTI Oil is a type of Crude Oil sold on international markets. The WTI stands for West Texas Intermediate, one of three major types including Brent and Dubai Crude. WTI is also referred to as “light” and “sweet” because of its relatively low gravity and sulfur content respectively. It is considered a high quality Oil that is easily refined. It is sourced in the United States and distributed via the Cushing hub, which is considered “The Pipeline Crossroads of the World”. It is a benchmark for the Oil market and WTI price is frequently quoted in the media.
Like all assets, supply and demand are the key drivers of WTI Oil price. As such, global growth can be a driver of increased demand and vice versa for weak global growth. Political instability, wars, and sanctions can disrupt supply and impact prices. The decisions of OPEC, a group of major Oil-producing countries, is another key driver of price. The value of the US Dollar influences the price of WTI Crude Oil, since Oil is predominantly traded in US Dollars, thus a weaker US Dollar can make Oil more affordable and vice versa.
The weekly Oil inventory reports published by the American Petroleum Institute (API) and the Energy Information Agency (EIA) impact the price of WTI Oil. Changes in inventories reflect fluctuating supply and demand. If the data shows a drop in inventories it can indicate increased demand, pushing up Oil price. Higher inventories can reflect increased supply, pushing down prices. API’s report is published every Tuesday and EIA’s the day after. Their results are usually similar, falling within 1% of each other 75% of the time. The EIA data is considered more reliable, since it is a government agency.
OPEC (Organization of the Petroleum Exporting Countries) is a group of 12 Oil-producing nations who collectively decide production quotas for member countries at twice-yearly meetings. Their decisions often impact WTI Oil prices. When OPEC decides to lower quotas, it can tighten supply, pushing up Oil prices. When OPEC increases production, it has the opposite effect. OPEC+ refers to an expanded group that includes ten extra non-OPEC members, the most notable of which is Russia.
Recommended Articles


