


Ripple Price Forecast: XRP trades below $1.10 amid persistent technical weakness
- XRP remains below the critical $1.10 level as bears tighten their grip, aiming for lows toward $1.00.
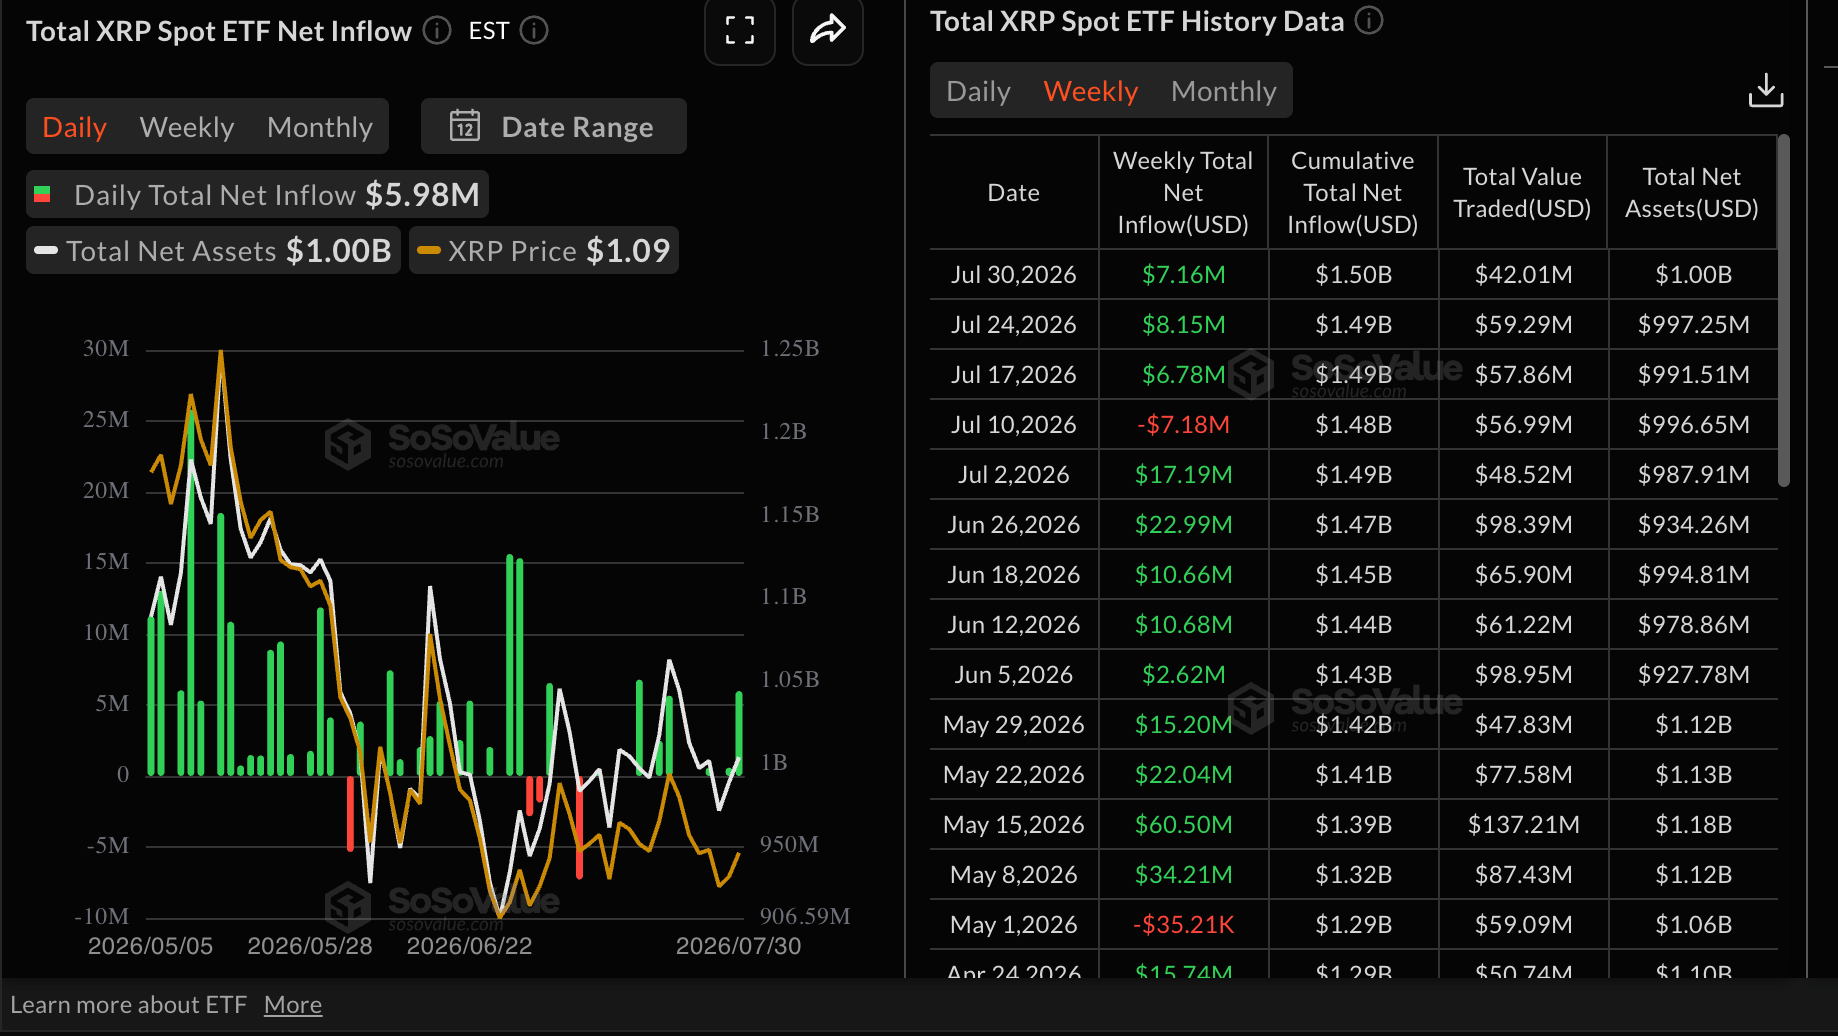
- US-listed spot XRP ETF inflows above $7 million through Thursday.
- Technical outlook remains weak, with XRP trading below falling moving averages and momentum indicators deteriorating.
Ripple (XRP) retains a bearish near-term tone on Friday, falling toward the psychological support at $1.00. This follows renewed inflation concerns in the United States (US) after the Federal Reserve (Fed) left interest rates unchanged, as two members of the committee dissented in favor of a 25 basis point hike.
“Three policymakers, Hammack, Kashkari and Logan, voted for an immediate 25bp hike, reinforcing concerns that inflation remains restrictive enough to keep the Committee biased toward tighter policy,” analysts at Crypto Finance highlighted.
XRP ETFs post inflows despite weak sentiment
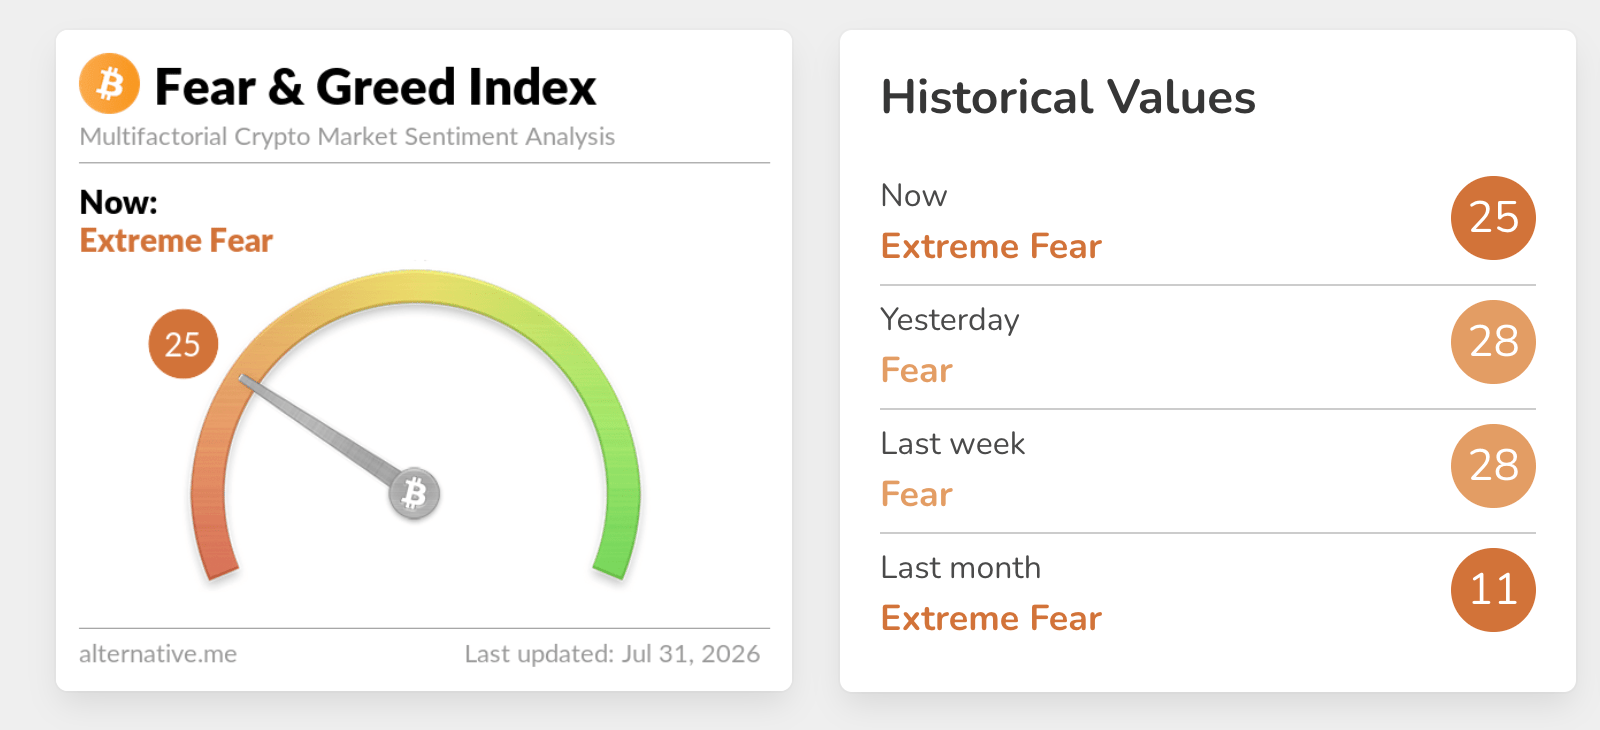
Risk appetite continues to wane this week, with the Fear & Greed Index slipping to 25, firmly in Fear territory, down from 28 just a day earlier. Sustained risk-off sentiment may keep XRP’s upside capped, further encouraging selling among investors.
XRP spot Exchange-Traded Funds (ETFs) inflows surged to nearly $6 million on Thursday, up from a mere $585,000 the day before. So far this week, cumulative inflows stand slightly above $7 million through Thursday. The surge underpins targeted risk-on sentiment for XRP investment products, despite the overall crypto market’s dull outlook due to geopolitical tensions and macroeconomic uncertainty.
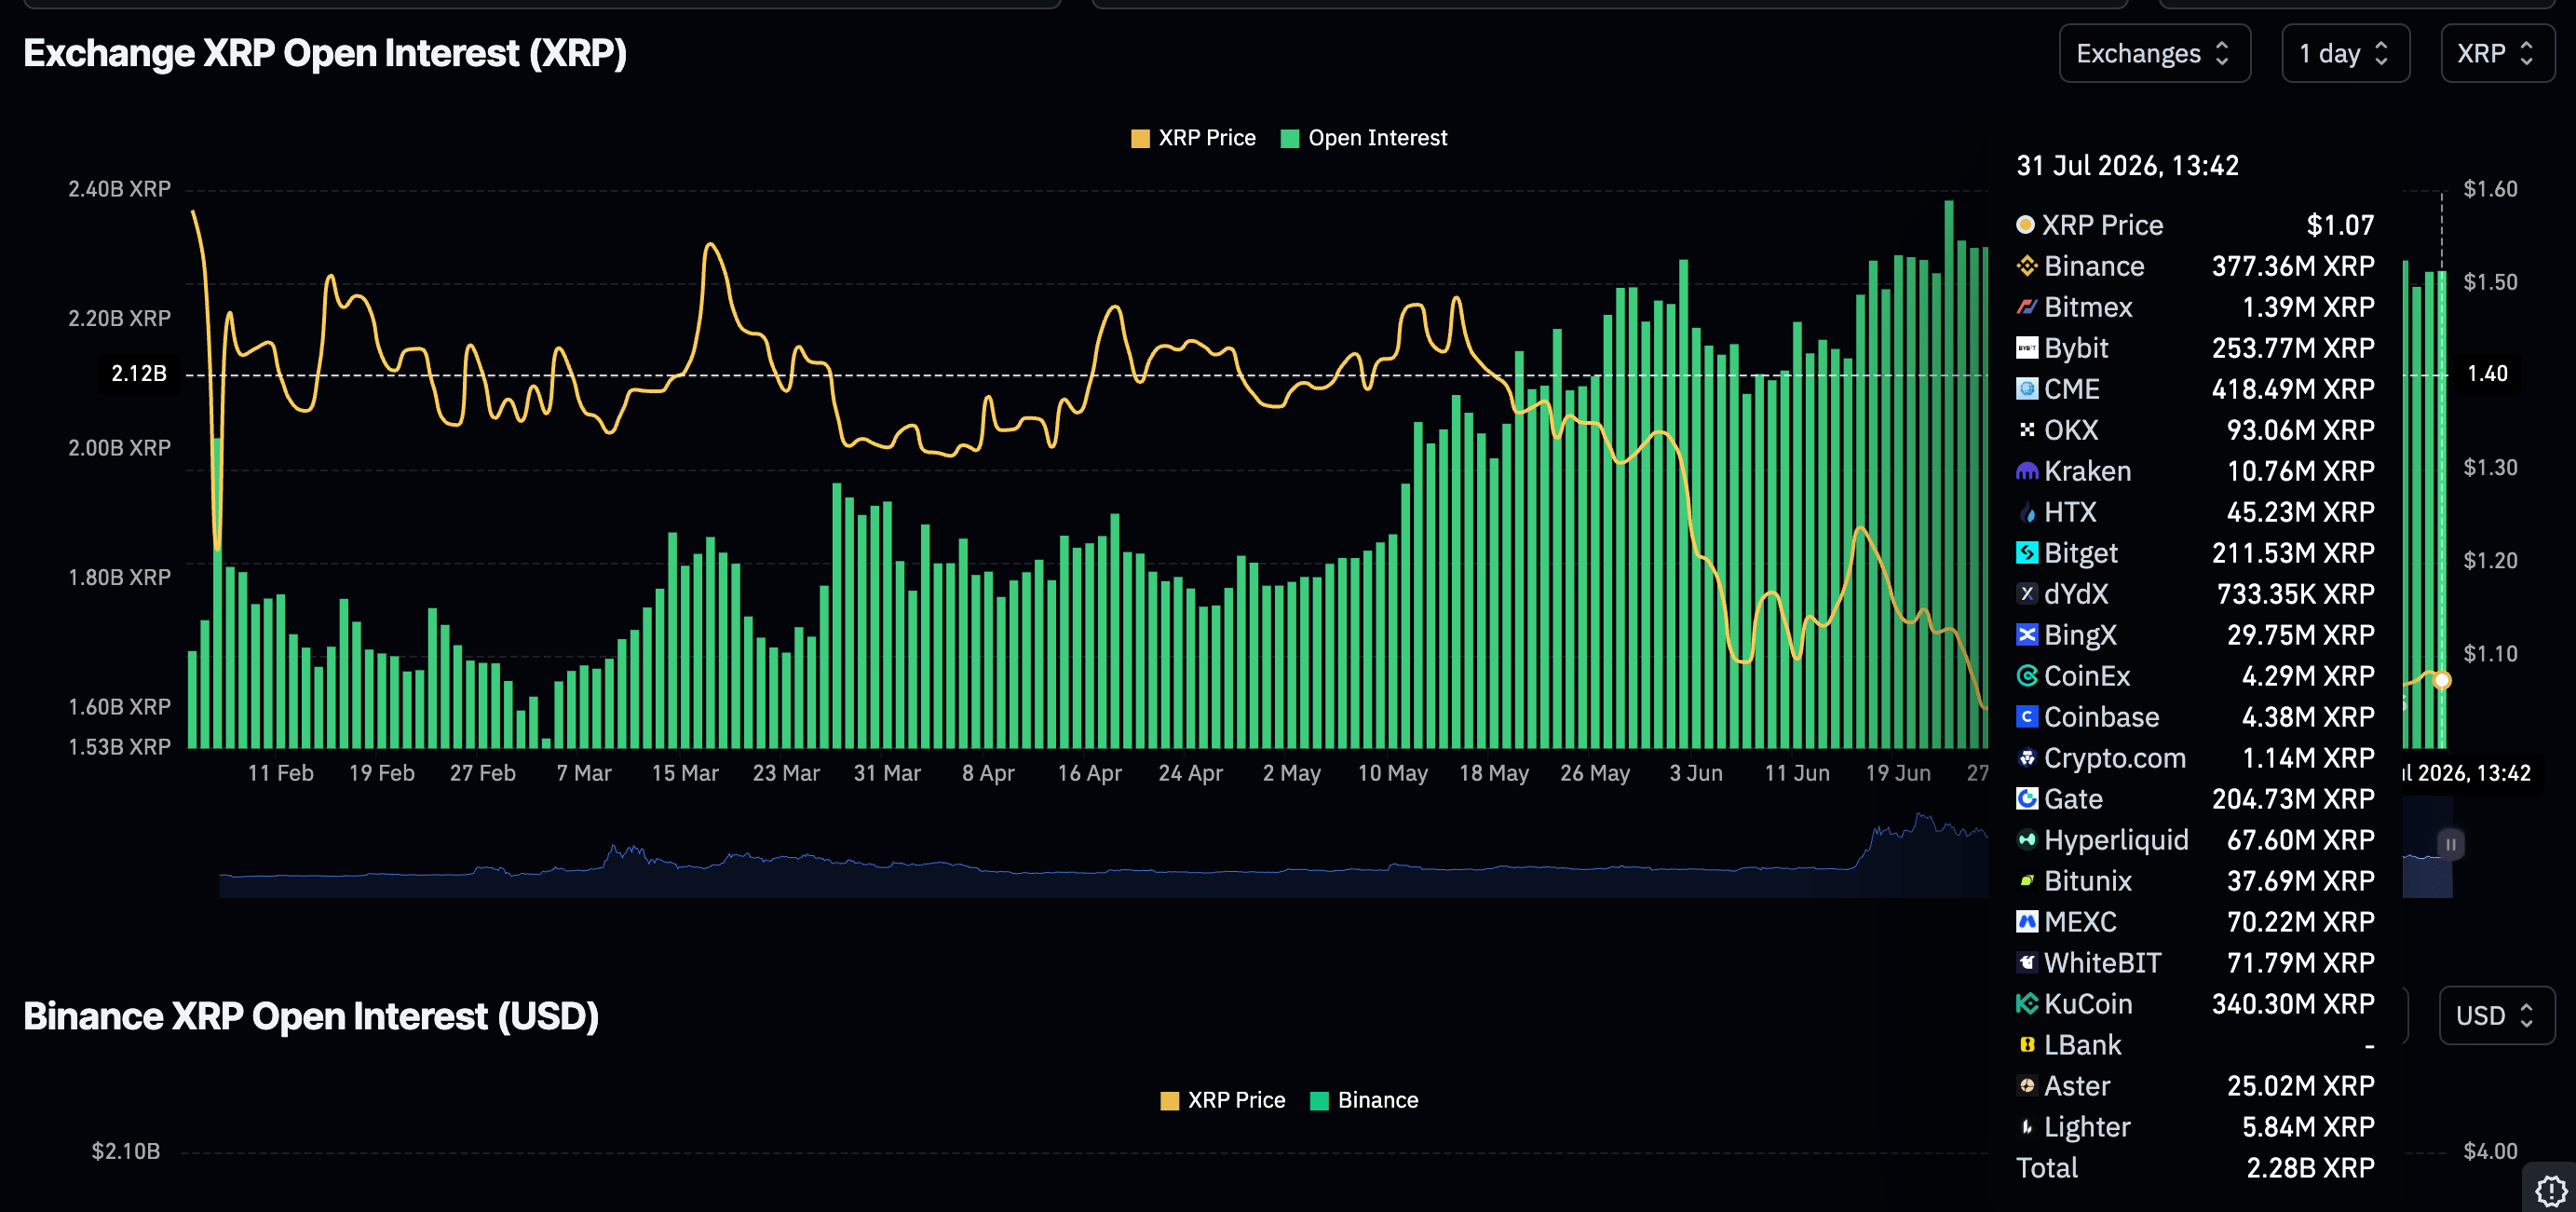
Meanwhile, retail demand is holding steady, with perpetual futures Open Interest (OI) averaging 2.28 billion XRP on Friday, up only marginally from 2.27 billion the previous day. If sustained, this gradual increase from 2.10 billion XRP on July 13 would absorb selling pressure, creating a suitable environment for an upside move above the resistance at $1.10.
Technical Analysis: XRP bears tighten grip
XRP trades at $1.07, keeping a bearish near-term tone as price holds well below the 50-day, 100-day and 200-day Exponential Moving Averages (EMAs). The cluster formed by the 78.6% Fibonacci retracement around $1.12 and the 50-day EMA at $1.13 sits just overhead as the first cap, reinforcing the downside bias.
At the same time, the Relative Strength Index (RSI) around 44 leans soft without being oversold, while the Moving Average Convergence Divergence (MACD) histogram remains slightly negative, hinting that bearish momentum is present but not particularly aggressive.
-1785498580000.png)
On the topside, initial resistance lies at the 78.6% Fibonacci retracement roughly at $1.12, followed closely by the 50-day EMA at $1.13, with the 100-day EMA at $1.21 and the 61.8% Fibonacci retracement at $1.22 marking a broader supply band if buyers attempt a stronger rebound. Further up, additional barriers align at the 50% Fibonacci retracement near $1.28 and the 38.2% level at $1.34, ahead of the 200-day EMA around $1.41 and the 23.6% Fibonacci retracement at $1.42.
On the downside, the next notable support emerges at the prior swing low and 100% Fibonacci anchor around $1.01, where sellers could hesitate if the pair extends its slide.
(The technical analysis of this story was written with the help of an AI tool. Know more.)
Open Interest, funding rate FAQs
Higher Open Interest is associated with higher liquidity and new capital inflow to the market. This is considered the equivalent of increase in efficiency and the ongoing trend continues. When Open Interest decreases, it is considered a sign of liquidation in the market, investors are leaving and the overall demand for an asset is on a decline, fueling a bearish sentiment among investors.
Funding fees bridge the difference between spot prices and prices of futures contracts of an asset by increasing liquidation risks faced by traders. A consistently high and positive funding rate implies there is a bullish sentiment among market participants and there is an expectation of a price hike. A consistently negative funding rate for an asset implies a bearish sentiment, indicating that traders expect the cryptocurrency’s price to fall and a bearish trend reversal is likely to occur.
Recommended Articles


