

Crypto Fear and Greed Index drops to 12 as global selloff deepens
The Crypto Fear and Greed Index stood at 12 on June 6, its lowest in weeks, as Bitcoin dropped to $61,100 and losses spread across every major coin.
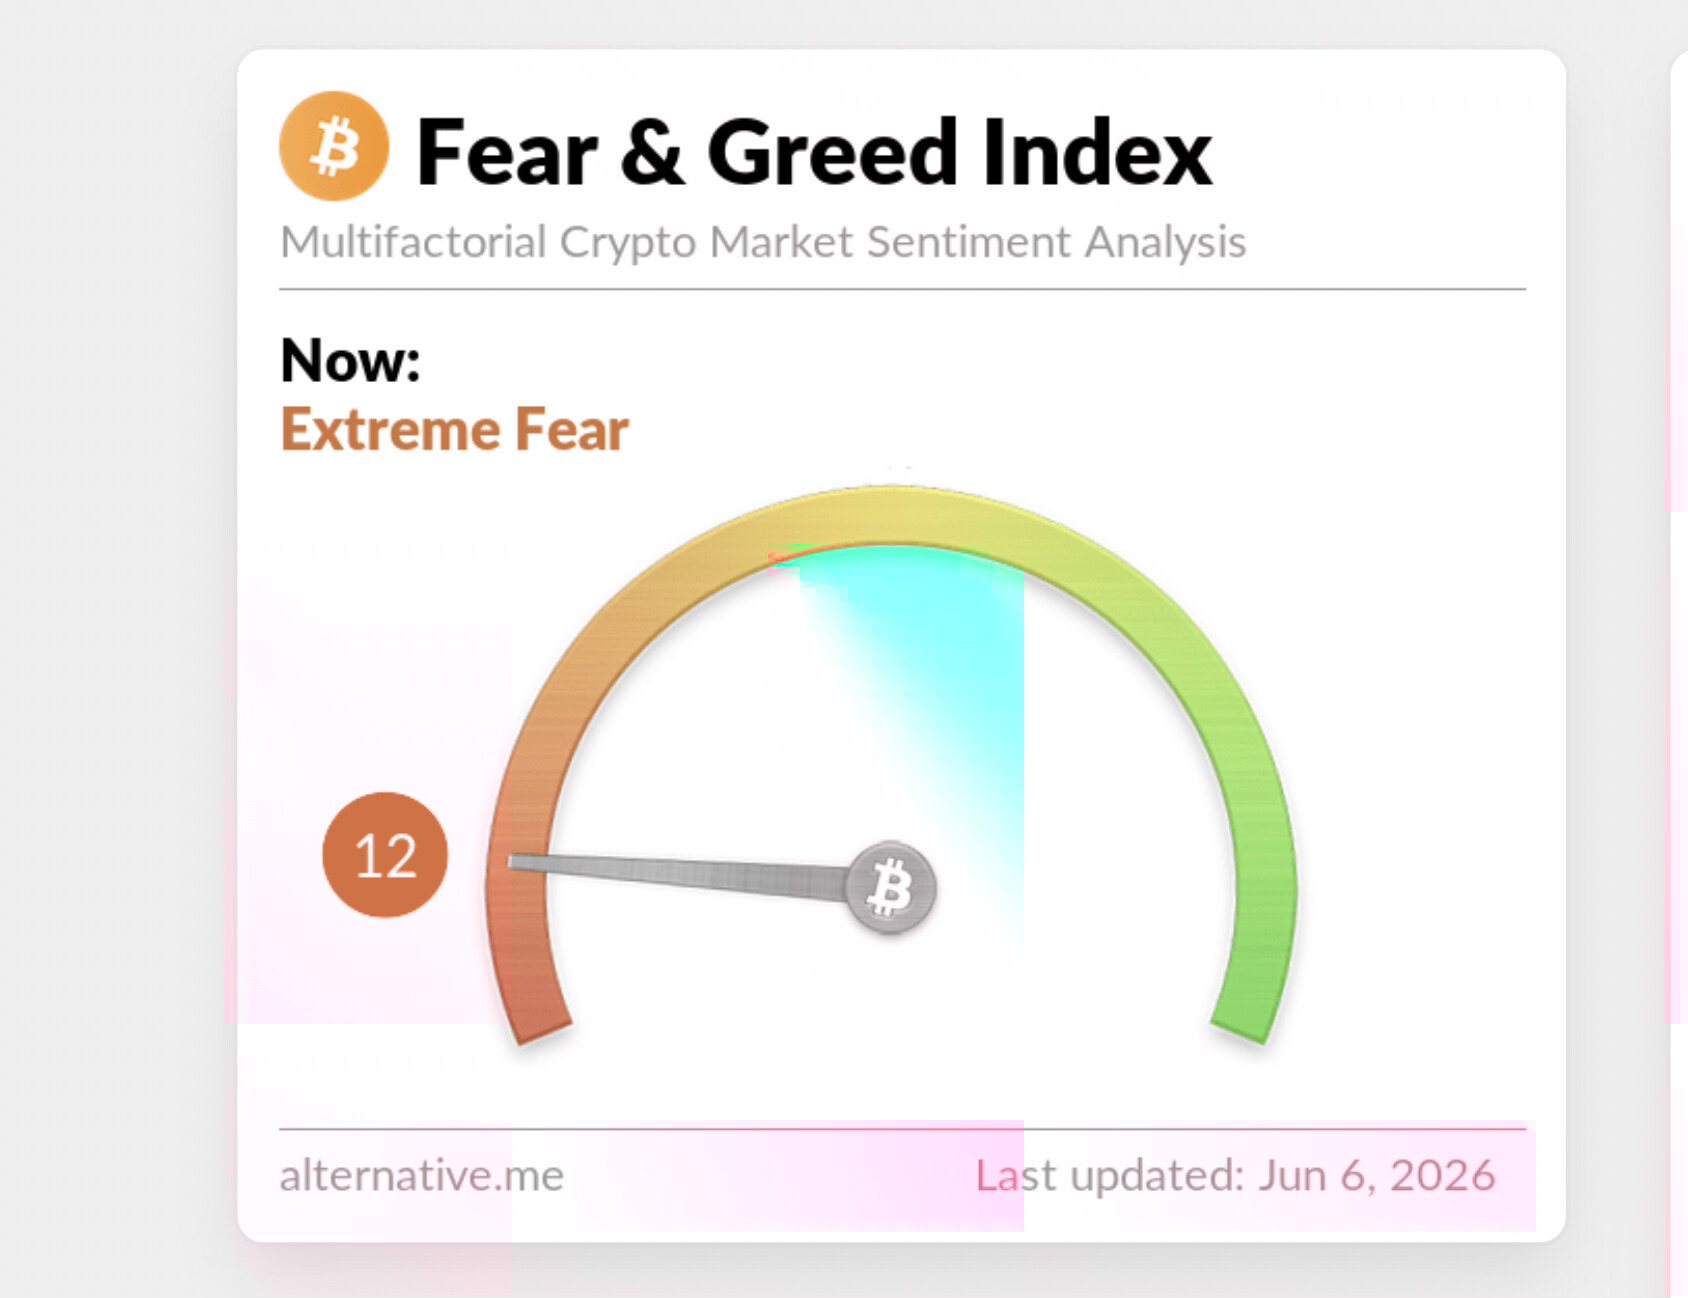
The Alternative.me index measures sentiment on a scale of zero to 100. At 12, the market sat deep in extreme fear, down from 13 on June 5 and about 52 a week earlier. Bitcoin fell to its lowest intraday level since February as capital kept draining from crypto funds.
Spot Bitcoin ETFs recorded their 13th straight day of net outflows, with close to $400 million pulled on Wednesday alone, according to JPMorgan’s Kenneth Worthington. The streak has erased more than $4 billion from the funds since mid-May.
Bitcoin, Ether, and the major altcoins all slid together
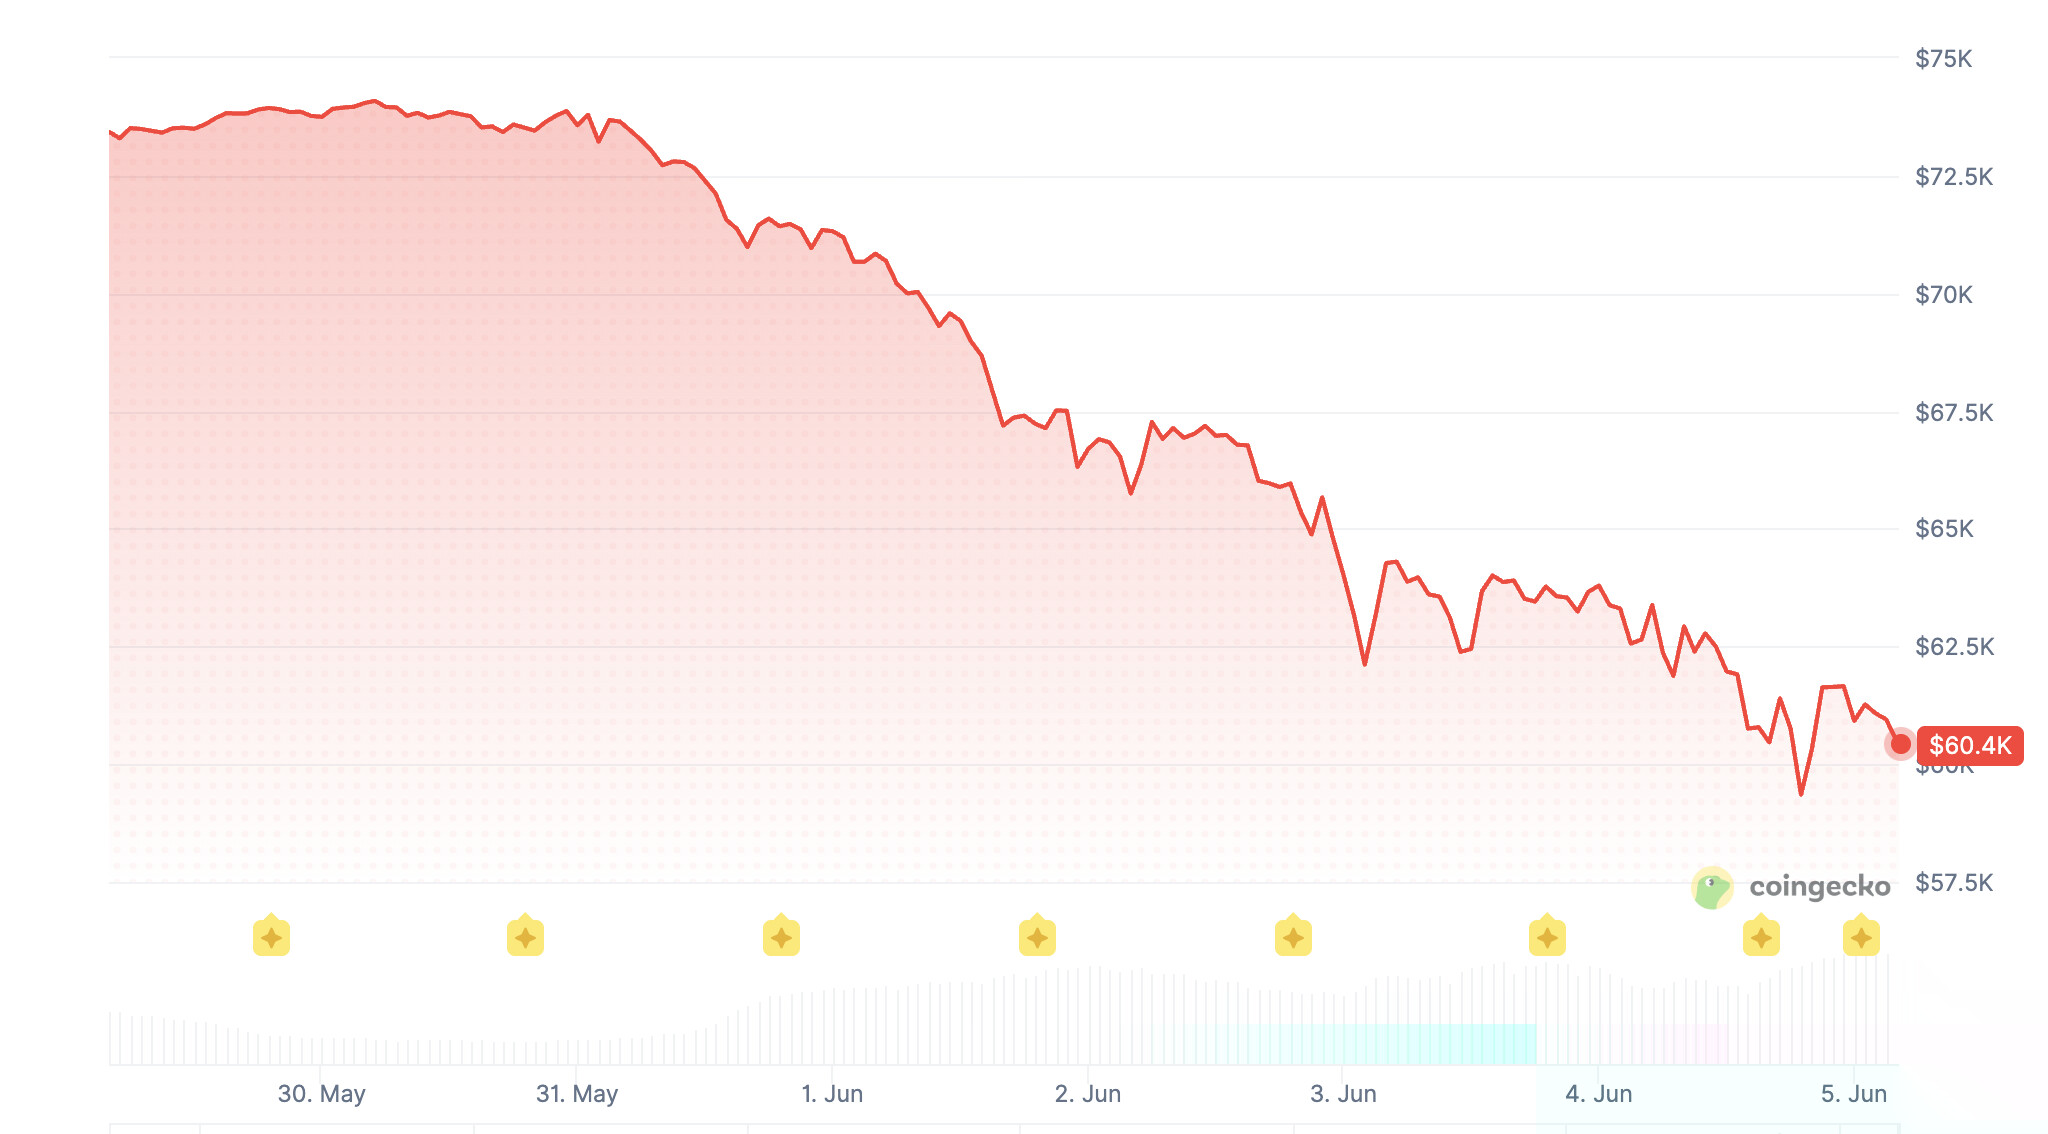
Bitcoin fell under $70,000 in early June and slid further to around $61,100, per ChainCatcher and CFGI.io, hovering just above its 200-week moving average near $61,300, a level that has marked long-term floors in past cycles.
Ether fared worse, dropping below $2,000 to trade near $1,585. The seven-day sentiment average was 19 as of June 5, the 30-day average 30, showing how fast the mood turned.
The damage ran across the board. ChainCatcher data on June 6 shows BNB down 3.9%, XRP off 4.4%, Solana down 6.4%, and Cardano weaker still at 8%, with ADA sliding toward multi-year lows.
CFGI.io, which tracks sentiment across more than 50 tokens, placed both Bitcoin and Ether in extreme fear, with most other majors in fear mode and only a handful of smaller tokens neutral. DEXTools said total crypto market cap lost around $110 billion over 24 hours during the early-June selling.
Extreme fear has marked past bottoms, but not always quickly
A reading of 12 sits near levels historically tied to capitulation. Since the index launched in 2018, comparable lows appeared at the December 2018 bear-market bottom, the March 2020 COVID crash, the June 2022 Terra-LUNA collapse, and the August 2024 selloff.
In each case the market eventually recovered, though the timing varied widely. After Terra-LUNA, the index hit single digits months before Bitcoin reached its cycle low.
Readings below 20 have often preceded stronger medium-term returns, but they flag panic rather than the exact point where prices stop falling.
The next index revision is scheduled for June 7. Traders are watching whether Bitcoin can reclaim $60,000 and whether the ETF outflows ease after a full week of redemptions, the clearest signal that institutional selling may be slowing.
The smartest crypto minds already read our newsletter. Want in? Join them.
Recommended Articles


