

Ethereum could rally following innovative EIP-3074 wallet integrations
- Ethereum developers approve adding Ethereum Improvement Proposal EIP-3074 to Pectra hard fork.
- EIP-3074 is meant to reduce gas fees, improve wallet experience for users despite security concerns.
- JPMorgan analysts maintain 50% odds of a spot Ethereum ETF approval in May.
Ethereum's (ETH) price took a slight dip on Friday following the general stagnancy in the crypto market. While ETH's price movement has been slow in the past week, its long-term future could prove interesting as Ethereum developers approved that EIP-3074 be included in the upcoming Pectra hard fork.
Also read: Ethereum price recovers slightly as whales begin accumulation spree
Daily digest market movers: EIP-3074 and JP Morgan ETF prediction
Ethereum saw a slight activity boost on Friday following recent developments within its ecosystem. Here are your key market movers:
- On Thursday, developers approved EIP-3074 to join the list of upgrades that the Pectra hard fork would bring to the Ethereum Mainnet. EIP-3074 introduces new functionalities that empower normal wallets with smart contract functionality. Some of the key features include batching several transactions and signing them once, sponsored transactions that allow platforms or others to pay gas fees for users, account automation, and a wallet recovery option.
Many community members expressed their delight at the proposal, stating how it will improve users' wallet experience and boost Ethereum's retail acceptance.
Popular crypto enthusiast Cygaar commented on X: "This EIP will forever change how users interact on EVM chains, making wallet UX simpler, cheaper, and more powerful." Bankless podcast host, Ryan Sean Adams also commented:The next big thing in Ethereum to look forward to is EIP-3074.
— RYAN SΞAN ADAMS - rsa.eth (@RyanSAdams) April 12, 2024
It gives your existing ETH wallet new superpowers:
- no extra click approvals
- no gas fees (someone else pays)
- wallet recovery
Smooooth wallet UX - the venmo experience.
When?
Next Ethereum hardfork. - Amid the excitement surrounding the proposal, some crypto community members have raised concerns that it could introduce potential vulnerabilities. One user said in an X post, "I don't wanna be the party pooper, but let me simply add the warning that it also adds the ability to drain all your assets with just one (...) signature."
An Anonymous DeFiLlama developer also contributed to the security concerns in another X post: "The downside of EIP 3074 is that now it'll be possible to fully drain an address (all tokens, all NFTs, all defi positions...) with only one bad signature."
This update will likely go live on Ethereum when the Pectra hard fork occurs between late December 2024 and early January 2025.
Read more: Ethereum extends correction as Van Eck CEO dampens chances of spot ETH ETF approval
- Meanwhile, analysts at JPMorgan, led by Nikolaos Panigirtzoglou, said in a report on Thursday that odds for a spot Ethereum ETF approval by the Securities & Exchange Commission (SEC) in May remain at 50%, citing the recent investigation into the Ethereum Foundation as a major reason. They further stated that there would likely be litigation against the regulator if it doesn't approve the ether ETFs in May. The SEC would lose the litigation, and a spot Ethereum ETF would eventually be approved, said JPMorgan analysts.
Technical analysis: Ethereum's sideways movement continues
Ethereum long traders saw another day of high liquidations as its price slightly dipped to $3,448 on Friday. ETH liquidations reached $26.9 million in the past 24 hours with liquidated long positions accounting for $21 million.
As earlier predicted, the continued horizontal price movement shows traders are exercising caution following increased doubts about a spot Ethereum ETF approval by the SEC. The sideways movement will likely continue until key events like the Bitcoin halving.
Also read: Ethereum could be set for growth as Vitalik Butein shares update on its future
If the bullish expectations fueled by the halving are eventually reflected in price, ETH could break past the $3,730 resistance of April 8.
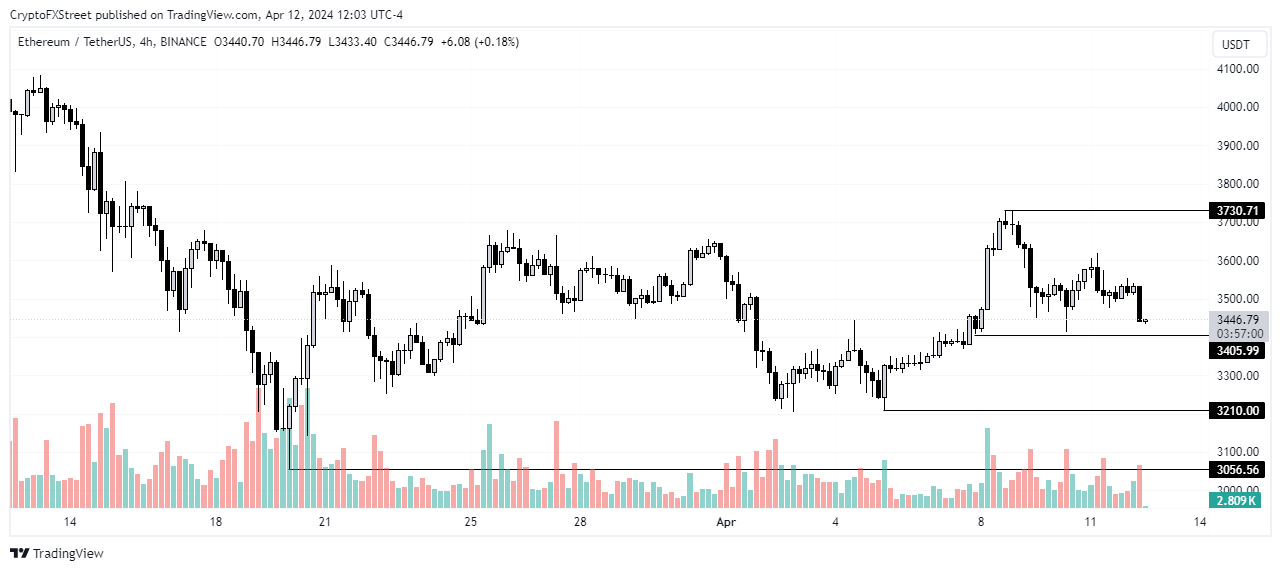
ETH/USDT 4-hour chart
However, if it doesn't, the sideways movement may continue, and ETH may tag $3,405. A bearish trend would likely break out if bears prevail and ETH breaks key support levels of $3,210 and $3,056, seen recently.
Ethereum is trading at $3,446, down 1.4% at the time of writing.
Bitcoin, altcoins, stablecoins FAQs
Bitcoin is the largest cryptocurrency by market capitalization, a virtual currency designed to serve as money. This form of payment cannot be controlled by any one person, group, or entity, which eliminates the need for third-party participation during financial transactions.
Altcoins are any cryptocurrency apart from Bitcoin, but some also regard Ethereum as a non-altcoin because it is from these two cryptocurrencies that forking happens. If this is true, then Litecoin is the first altcoin, forked from the Bitcoin protocol and, therefore, an “improved” version of it.
Stablecoins are cryptocurrencies designed to have a stable price, with their value backed by a reserve of the asset it represents. To achieve this, the value of any one stablecoin is pegged to a commodity or financial instrument, such as the US Dollar (USD), with its supply regulated by an algorithm or demand. The main goal of stablecoins is to provide an on/off-ramp for investors willing to trade and invest in cryptocurrencies. Stablecoins also allow investors to store value since cryptocurrencies, in general, are subject to volatility.
Bitcoin dominance is the ratio of Bitcoin's market capitalization to the total market capitalization of all cryptocurrencies combined. It provides a clear picture of Bitcoin’s interest among investors. A high BTC dominance typically happens before and during a bull run, in which investors resort to investing in relatively stable and high market capitalization cryptocurrency like Bitcoin. A drop in BTC dominance usually means that investors are moving their capital and/or profits to altcoins in a quest for higher returns, which usually triggers an explosion of altcoin rallies.
Recommended Articles


