

Dogecoin Bullish Kumo Breakout, But Can DOGE Overcome The $0.23804 Barrier?

Source Newsbtc

Dogecoin flashes a bullish signal after crashing through the Kumo. However, with the $0.23 resistance in the spotlight, the question remains: Can DOGE clear this hurdle and rekindle its rally momentum?

Cloud Turns Support: Kumo Now Shields Bitcoin Price Action

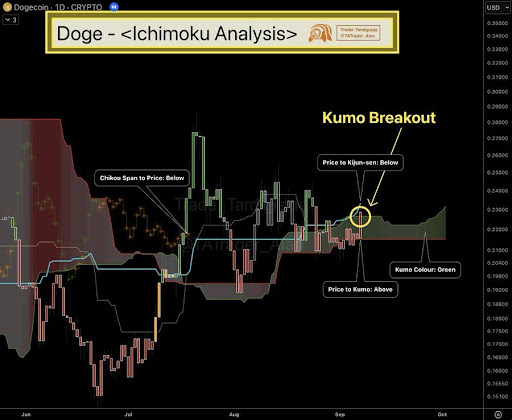
In a recent analysis shared on X, crypto analyst Trader Tardigrade provided an updated technical outlook on DOGE’s price action using the Ichimoku indicator. The analysis points to a significant development: a Kumo breakout, which has triggered a long trade signal for the cryptocurrency.

The analyst explained that this breakout is a crucial turning point, as the Kumo, or “Cloud,” which previously acted as resistance, is now a key support zone for Dogecoin. Trader Tardigrade also specified the key support and resistance levels for Dogecoin based on the Ichimoku chart. The new support zone is highlighted by the Kumo itself, with a range of $0.21517 to $0.22661. This area is now expected to hold the price during any potential pullbacks.
Dogecoin

On the other hand, the immediate resistance is identified at $0.23804, which corresponds with the Ichimoku’s Kijun-sen line. A successful breakout above this level would confirm the bullish momentum and could lead to further gains for Dogecoin, according to the analysis.

Trend Analysis

Based on Trader Tardigrade’s analysis, the various components of the Ichimoku indicator present a mixed picture for Dogecoin’s trend, ultimately resulting in a neutral overall outlook. This complexity is revealed through a point-based system that scores the individual trend signals.

The first positive signal is the Kumo color, which is green, indicating a bullish bias. This is a key indicator within the Ichimoku system, as a green cloud signals that the faster-moving Senkou Span A is above the slower Senkou Span B, suggesting an upward momentum in the medium to long term.

However, the analysis also points to conflicting signals. While the mid-term trend is bullish, with the price remaining above the Kumo, the short-term trend is currently bearish, as the price is trading below the Kijun-sen. In the long term, the trend is also negative. This is indicated by the Chikou Span being below the current price. The Chikou Span, or lagging span, compares the current price to the price 26 periods ago. 

When it is below the current price, it suggests that the current momentum is weaker than the momentum from a month ago, indicating a potential long-term downtrend. With an overall score of zero after adding up the conflicting signals, the analysis concludes that Dogecoin is currently in a state of consolidation, without a clear directional bias at this time.

Dogecoin
Disclaimer: For information purposes only. Past performance is not indicative of future results.
placeholder
Anthropic is six times oversubscribed at $1.4 trillion while Nvidia is down 32% — the AI trade has two pricesAnthropic lists on Nasdaq as ANT on Thursday at $70 ~ $78 a share, raising up to $64.4 billion at a target valuation near $1.4 trillion, and the book is reportedly six times covered. In the same six weeks, Nvidia has fallen 32% and the QQQ is 10.9% below its October peak. Private capital and public markets are marking the same AI complex at two very different prices. This piece separates the two books: what the S-1 shows, who is anchoring the $26 billion private placement, and what Thursday's debut would have to do to change the public tape.
Author  Irene Q.
Nov 16, Mon
Anthropic lists on Nasdaq as ANT on Thursday at $70 ~ $78 a share, raising up to $64.4 billion at a target valuation near $1.4 trillion, and the book is reportedly six times covered. In the same six weeks, Nvidia has fallen 32% and the QQQ is 10.9% below its October peak. Private capital and public markets are marking the same AI complex at two very different prices. This piece separates the two books: what the S-1 shows, who is anchoring the $26 billion private placement, and what Thursday's debut would have to do to change the public tape.
placeholder
Gold Price Analysis Today | Forex Gold Analysis | XAU/USD Analysis - November 16, 2026Get the latest gold price analysis, forex gold insights, and XAU/USD analysis for November 16, 2026. Read on for the details.
Author  Mitrade
Nov 16, Mon
Get the latest gold price analysis, forex gold insights, and XAU/USD analysis for November 16, 2026. Read on for the details.
placeholder
Weekly Report: DXY 103.41, 10-year 5.15%, AUD carry 3bp — three FX regimes flipped in one weekThe dollar index rose 1.09% to 103.41, a 19-month high, while the US 10-year closed at 5.154% and the Australia-US two-year spread collapsed to about 3 basis points from 36. EURUSD fell 1.59% to 1.1024, USDJPY rose 1.51% to 159.78 and AUDUSD fell 1.79% to 0.6764, a 10-month low. Three FX regimes — the broad dollar, the US rate level and the Australian carry premium — flipped in the same week. This report marks the thresholds, ranks which one can flip back first, and lists the week's calendar.
Author  Irene Q.
Nov 16, Mon
The dollar index rose 1.09% to 103.41, a 19-month high, while the US 10-year closed at 5.154% and the Australia-US two-year spread collapsed to about 3 basis points from 36. EURUSD fell 1.59% to 1.1024, USDJPY rose 1.51% to 159.78 and AUDUSD fell 1.79% to 0.6764, a 10-month low. Three FX regimes — the broad dollar, the US rate level and the Australian carry premium — flipped in the same week. This report marks the thresholds, ranks which one can flip back first, and lists the week's calendar.
placeholder
Gold Price Analysis Today | Forex Gold Analysis | XAU/USD Analysis - November 17, 2026Get the latest gold price analysis, forex gold insights, and XAU/USD analysis for November 17, 2026. Read on for the details.
Author  Mitrade
Yesterday 05: 40
Get the latest gold price analysis, forex gold insights, and XAU/USD analysis for November 17, 2026. Read on for the details.
placeholder
Gold Price Analysis Today | Forex Gold Analysis | XAU/USD Analysis - November 18, 2026Get the latest gold price analysis, forex gold insights, and XAU/USD analysis for November 18, 2026. Read on for the details.
Author  Mitrade
5 hours ago
Get the latest gold price analysis, forex gold insights, and XAU/USD analysis for November 18, 2026. Read on for the details.
goTop
quote