Bitcoin CME gaps at $35,000, $27,000 and $21,000, which one gets filled first?

Trending Articles
coverImg
Source: DepositPhotos

Due to the Chicago Mercantile Exchange (CME) not trading over the weekends, price gaps known as "CME gaps" exist for Bitcoin. Currently, there are three unfilled gaps for BTC: two on the upside at $35,000 and $27,000, and one on the downside at $21,000.


What is a CME gap?

Starting from December 2017, Bitcoin (BTC) futures products have been listed by the Chicago Mercantile Exchange (CME). Since then, CME's BTC futures data has been crucial in identifying institutional flows and interest.


While cryptocurrency trading operates 24/7, CME's BTC futures trading takes weekends off. As a result, a gap exists between Friday's closing price and Monday's opening price, which is commonly referred to as a "CME gap" within the crypto community.


Do CME gaps self-heal?

Since their launch in 2017, CME's Bitcoin futures have consistently shown weekend gaps. However, investors have noticed that these gaps often get filled as the price moves upward. This regular occurrence has driven investor behavior, with traders anticipating gap fillings and creating a self-fulfilling prophecy.


The most recent CME gap formed after the crash on August 17th, expanding from $27,005 to $27,485. The other two gaps are at 31% and 19% away from the Friday's closing price of $26,070. The upper range is $34,445 to $35,180, while the CME downside range is $20,330 to $21,110. So, will these three gaps be filled?


BTC CME 期貨 1 日圖

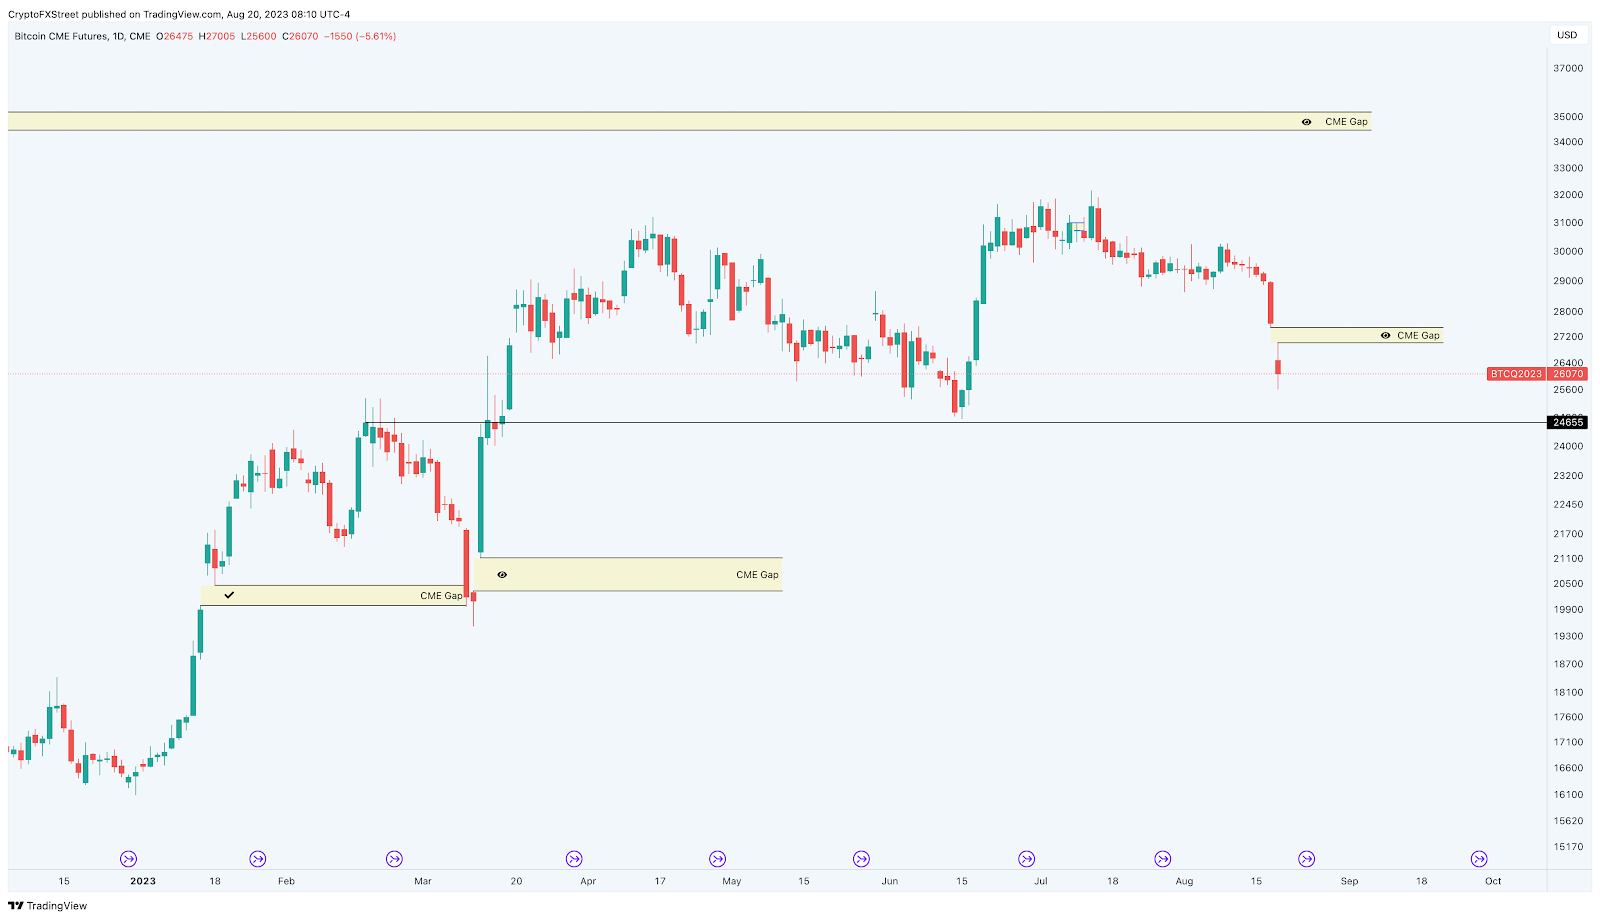
CME Bitcoin Futures daily price chart, Source: TradingView.


Which CME gaps are likely to be filled first?

Bitcoin's price has been in a downtrend, down nearly 20% since July 13th. With BTC hovering around the $26,000 level, there is a high probability of a minor recovery bounce. Therefore, the CME gap at that level is likely to be filled first.


Looking at the daily chart, the Relative Strength Index (RSI) has entered oversold territory for the first time in nine months, indicating an impending rebound. This retracement is expected to fill the CME gap from $27,005 to $27,485 and potentially attempt to move higher.


BTC/USDT 1 日圖

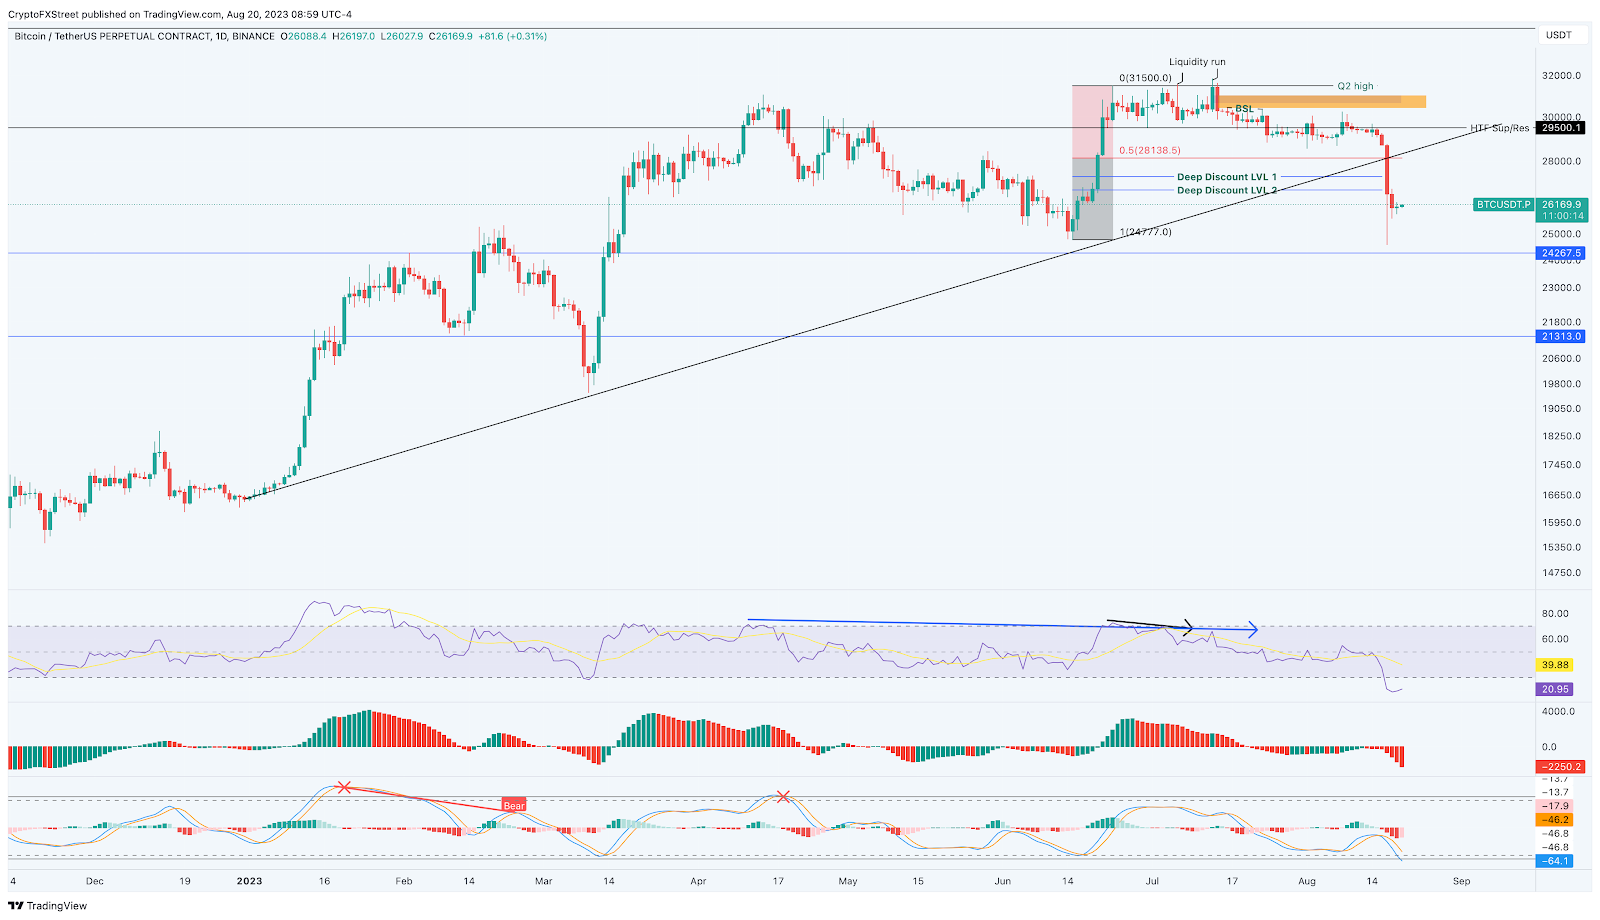
BTC/USDT daily price chart, Source: TradingView.


In rare cases, Bitcoin's price may break through the liquidity barrier at $30,400 stop-loss levels, but it is unlikely to gain upward momentum. If the price doesn't improve and hash rate increases, it could prompt Bitcoin miners to sell their earnings, disrupting the recovery and triggering a sell-off frenzy. In such a scenario, BTC might experience a sharp decline and touch the CME gap from $20,330 to $21,110.


Read more

  • Silver Price Forecast: XAG/USD jumps above $90 as AI valuation risks boost safe-haven demand
  • Note: If you want to share the article 《Bitcoin CME gaps at $35,000, $27,000 and $21,000, which one gets filled first?》, make sure you retain the original link. For more information, please visit Insights or browse www.mitrade.com.

    * The content presented above, whether from a third party or not, is considered as general advice only.  This article should not be construed as containing investment advice, investment recommendations, an offer of or solicitation for any transactions in financial instruments.

    goTop
    quote
    Related Articles
    placeholder
    Top 3 Price Prediction: Bitcoin, Ethereum, Ripple – BTC, ETH and XRP consolidate with short-term cautious bullish biasBitcoin (BTC), Ethereum (ETH) and Ripple (XRP) are consolidating near key technical areas on Friday, showing mild signs of stabilization after recent volatility.
    Author  FXStreet
    Feb 27, Fri
    Bitcoin (BTC), Ethereum (ETH) and Ripple (XRP) are consolidating near key technical areas on Friday, showing mild signs of stabilization after recent volatility.
    placeholder
    Bitcoin Rebounds After Falling to $62,500 Low, Crypto Market Still Extremely FearfulDuring the U.S. trading session on February 24, Bitcoin (BTC) dropped to $62,500, dragging down the broader crypto market. Today's Fear and Greed Index rose to 11, remaining in the "Extre
    Author  TradingKey
    Feb 25, Wed
    During the U.S. trading session on February 24, Bitcoin (BTC) dropped to $62,500, dragging down the broader crypto market. Today's Fear and Greed Index rose to 11, remaining in the "Extre
    placeholder
    Top 3 Price Prediction: BTC breakdown hints at deeper correction as ETH and XRP extend lossesBitcoin (BTC), Ethereum (ETH) and Ripple (XRP) prices are extending losses on Monday after falling slightly the previous week. BTC is slipping below the lower consolidation range at $65,000, and ETH is falling below $1,900, both extending their six-week losing streaks.
    Author  FXStreet
    Feb 23, Mon
    Bitcoin (BTC), Ethereum (ETH) and Ripple (XRP) prices are extending losses on Monday after falling slightly the previous week. BTC is slipping below the lower consolidation range at $65,000, and ETH is falling below $1,900, both extending their six-week losing streaks.
    placeholder
    Top 3 Price Prediction: BTC, ETH and XRP remain range-bound as breakdown risks riseBitcoin (BTC), Ethereum (ETH), and Ripple (XRP) are trading sideways within consolidation ranges on Friday, signaling a lack of directional bias in the broader crypto market.
    Author  FXStreet
    Feb 20, Fri
    Bitcoin (BTC), Ethereum (ETH), and Ripple (XRP) are trading sideways within consolidation ranges on Friday, signaling a lack of directional bias in the broader crypto market.
    placeholder
    Top 3 Price Prediction: Bitcoin, Ethereum, Ripple – BTC, ETH and XRP face downside risk as bears regain control Bitcoin (BTC), Ethereum (ETH), and Ripple (XRP) remain under pressure on Wednesday, with the broader trend still sideways. BTC is edging below $68,000, nearing the lower consolidating boundary, while ETH and XRP also declined slightly, approaching their key supports.
    Author  FXStreet
    Feb 18, Wed
    Bitcoin (BTC), Ethereum (ETH), and Ripple (XRP) remain under pressure on Wednesday, with the broader trend still sideways. BTC is edging below $68,000, nearing the lower consolidating boundary, while ETH and XRP also declined slightly, approaching their key supports.
    Live Quotes
    Name / SymbolChart% Change / Price
    BTCUSD
    BTCUSD
    0.00%0.00

    Bitcoin Related Articles

    • Gold vs Bitcoin 2026: Which Is the Better Investment?Best Hedge Asset Comparison
    • Best Strategies When BTC Price Drops: From Hedging to Accumulating
    • How to Day Trade Crypto? Simplest Day Trading Strategy Ever
    • Bitcoin Price Prediction 2026-2030: Long-Term Outlook Driven by Data & Macro Cycles
    • Bitcoin Mining Beginner Guide: What Is Bitcoin Mining and How to Mine Bitcoin?
    • ​Gold vs Bitcoin: Which Is the Better Investment Option?

    Click to view more