

Circle CCTP on Solana set to go live, will SOL price rally?
- The Cross-Chain Transfer Protocol (CCTP) will enable transfer of USDC from other blockchain networks to Solana.
- Stablecoins on Solana have reached their highest volume since November 2022, with USDC as the most popular one.
- USDC cross-chain functionality may see more value flowing into the Solana ecosystem.
Solana (SOL) may be set for a potential price rally as Circle will launch its Cross-Chain Transfer Protocol (CCTP) utility on its blockchain on Tuesday. Considering SOL’s recent upsurge in on-chain metrics and the liquidity inflow the CCTP will enable, many believe investors may resume their buying pressure on Solana and its ecosystem tokens.
Solana’s on-chain metrics show growth
Solana has seen tremendous growth in the past month following the crypto bull market and the meme coin mania that sent its price to levels last seen in 2022. The record-breaking highs seen by meme coins like dogwifhat (WIF), Book of Meme (BOME), Slerf (SLERF), etc., sent trading volume on the smart contract blockchain up by more than 350% to $3.42 billion on March 16.
With such increased attention also came a significant rise of nearly 134% in total value locked to $4.67 billion on Tuesday, a two-year high, according to data from DefiLlama.
Read more: Solana Price Prediction: SOL likely to fall another 20% before buyers step in
Circle CCTP may propell SOL’s price
Stablecoins dominate more than half of Solana’s TVL as its DEXs and yield-bearing platforms gain traction. USDC accounts for 71% of these stablecoins as it is currently the most popular asset on Solana.
Even with such a grip on the Solana ecosystem, Circle, the parent company behind USDC, is looking to strengthen its dominance through the launch of its Cross-Chain Transfer Protocol (CCTP) on the blockchain on Tuesday. CCTP helps to facilitate the permissionless transfer of USDC across different blockchain networks through a burning and minting method, according to Circle.
Also read: Solana-based Jupiter posts hefty returns amidst meme coin rally
When CCTP goes live, users can transfer their USDCs from other blockchain networks directly to Solana without going through centralized exchanges or third-party bridges. For example, users could transfer USDC from Ethereum, Polygon, Base, and other CCTP-enabled chains to Solana.
This would "open up a huge pathway for cross-chain stablecoin liquidity," said Jeremy Allaire, CEO of Circle, in an X post. With more liquidity flowing into the Solana ecosystem, combined with many other of its growing on-chain metrics, many investors have expressed opinions that SOL may be set for a price rally. One X user commented “bullish”, while another posted “yuge”.
The SOL/USDT daily chart shows that while SOL's price is consolidating, SOL may be set for a rally if it breaks past the recent high of $210 on March 18. This thesis will be invalidated if the price falls below last week's low of $162.51.
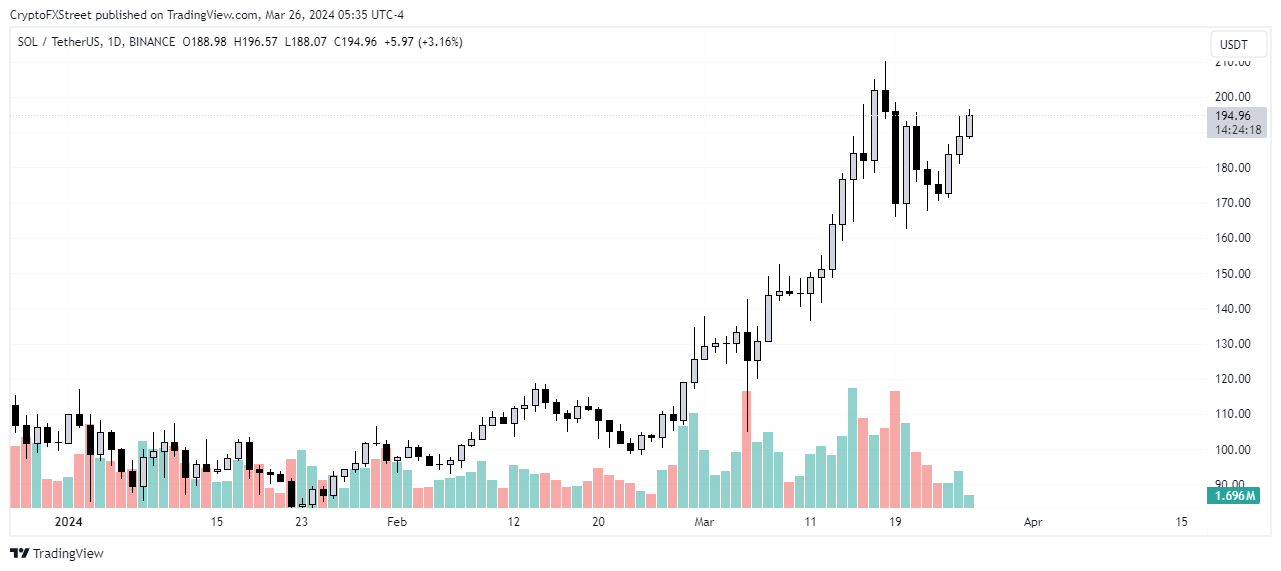
SOL/USDT 1-day chart
SOL is trading at $194.15, up 3.0% on the day as of the time of writing.
Recommended Articles


