

Crude Oil bumps higher on supply draws, WTI knocks on $81.00
- Crude Oil surged on Thursday as markets repriced growth outlook.
- IEA revised its demand outlook but still lags behind OPEC.
- API, EIA Crude Stocks both drew down this week.
West Texas Intermediate (WTI) US Crude Oil knocked into its highest bids in over three months, etching in a new high of $81.05 on Thursday as barrel traders rebalance their price outlook after US Crude Oil stocks fell more than expected this week and the Internation Energy Agency (IEA) lifted their demand growth outlook.
The IEA is now forecasting global Crude Oil demand to increase through 2024 by 1.3 million barrels per day, raising their initial forecasts by an additional 110K barrels per day. According to the IEA, stronger demand growth from the US as well as ongoing uncertainty surrounding ship attacks by Houthi rebels in the Red Sea are increasing demand for ship fuel as cargo ships reroute around the continent of Africa to connect Asia and European markets as Iranian-backed militants block access to the Suez Canal.
The IEA now expects global Crude Oil demand to average 103.2 million barrels per day in 2024, and the agency’s 2025 demand growth forecasts have increased by about 50% since first introducing their outlook in summer of last year. Despite the significant uptick in demand expectations, the IEA is still coming in well below demand expectations from the Organization of the Petroleum Exporting Countries (OPEC), which expects Crude Oil demand growth to add at least 2.2 million bpd to current demand through 2024.
US Crude Oil supplies declined more than expected this week as refineries kick in additional production. The American Petroleum Institute (API) saw a 5.5 million barrel drawdown for the week ended March 8 compared to the expected uptick of 400K barrels, while the Energy Information Administration (EIA) Crude Oil stocks fell 1.5 million over the same period, well below the forecast increase of 1.338 million barrels.
WTI technical outlook
WTI US Crude Oil climbed to a multi-month high of $81.50 on Thursday, tipping into $81.05 before settling back into the $80.50 level. WTI shot higher after rebounding from last week’s late swing low into $76.50. US Crude Oil has rallied nearly 60% bottom-to-top.
Daily candlesticks punched higher, piercing a long-standing consolidation range around the 200-day Simple Moving Average (SMA) near the $78.00 handle. US Crude Oil is up nearly 19% from November’s bottom bids near $68.00 per barrel.
WTI hourly chart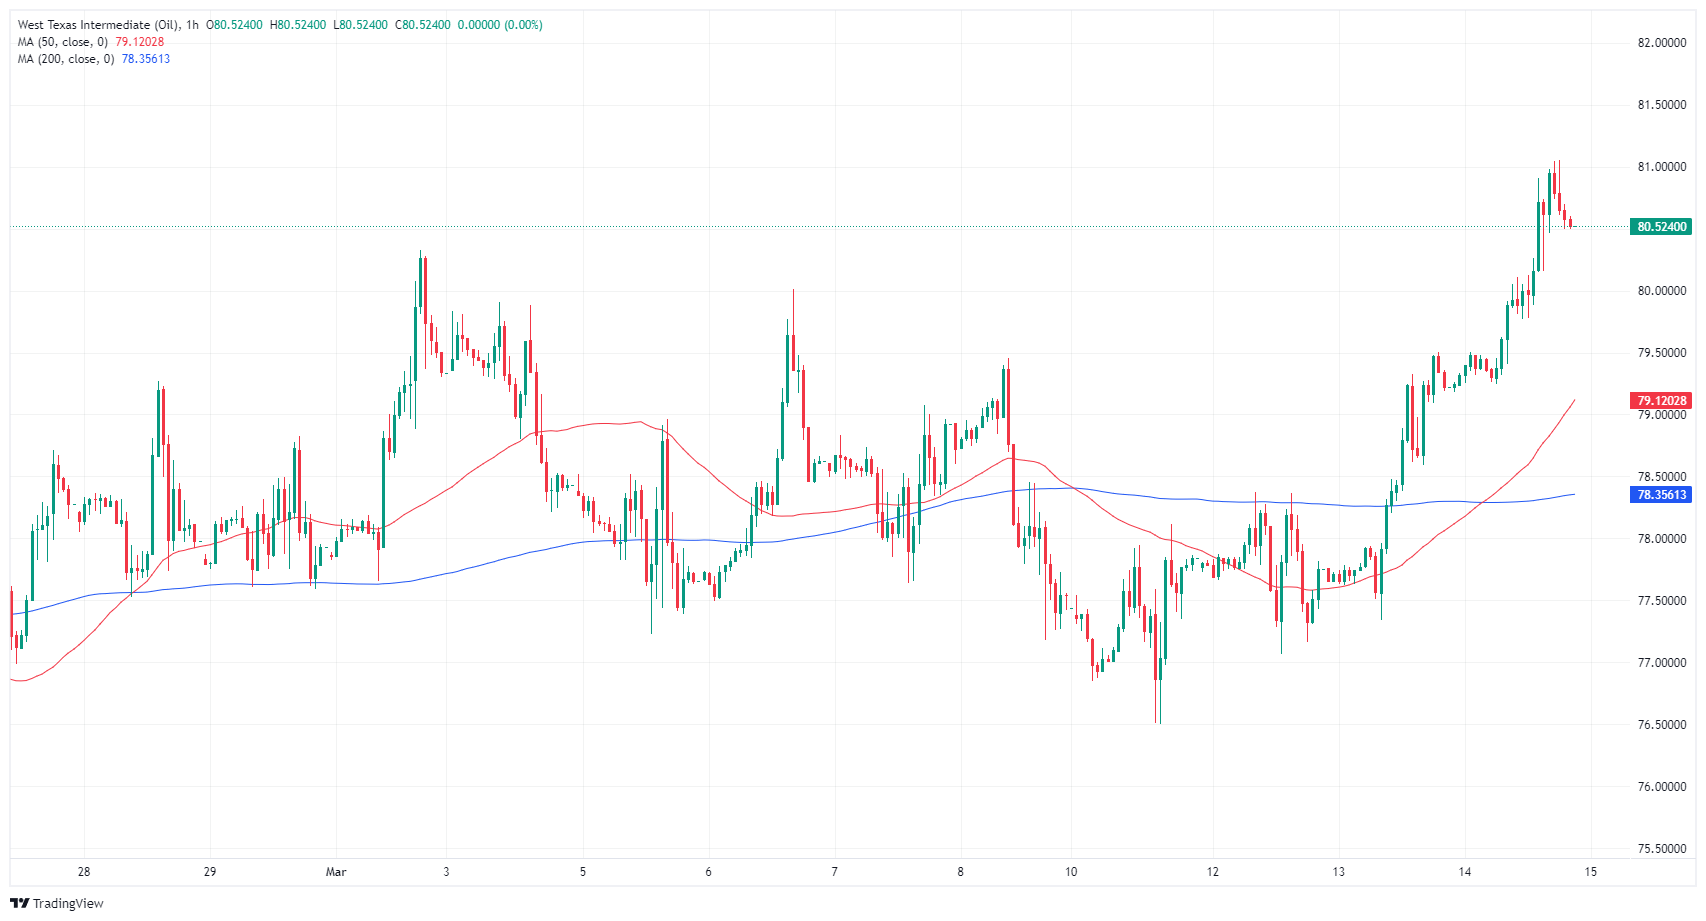
WTI daily chart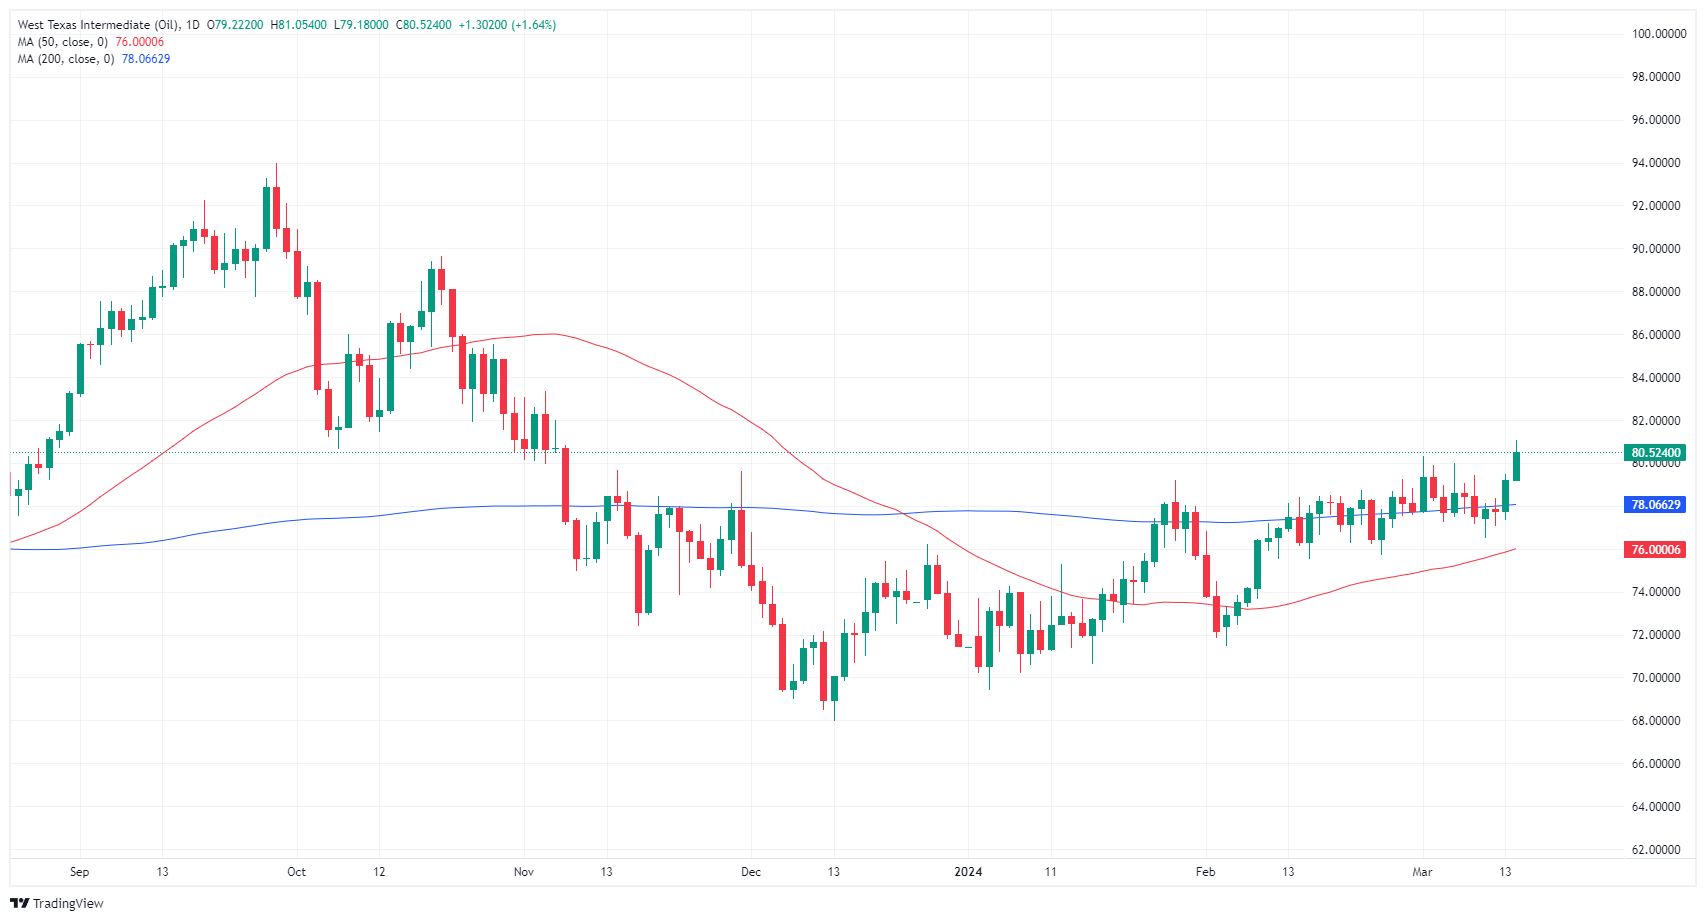
Recommended Articles


