

Silver Price Forecast: XAG/USD holds firm, negative divergence looms
- Silver trades at $32.35 after briefly touching a three-month high of $33.39.
- RSI remains bullish, but failure to confirm higher highs raises caution.
- Key support at $31.92; upside targets $32.50 and $33.00 psychological level.
Silver price edges higher and registered gains of over 0.70% on Monday as US financial markets remained closed in observance of Presidents’ Day. At the time of writing, XAG/USD trades at $32.35 as Tuesday’s Asian session begins, virtually unchanged.
XAG/USD Price Forecast: Technical outlook
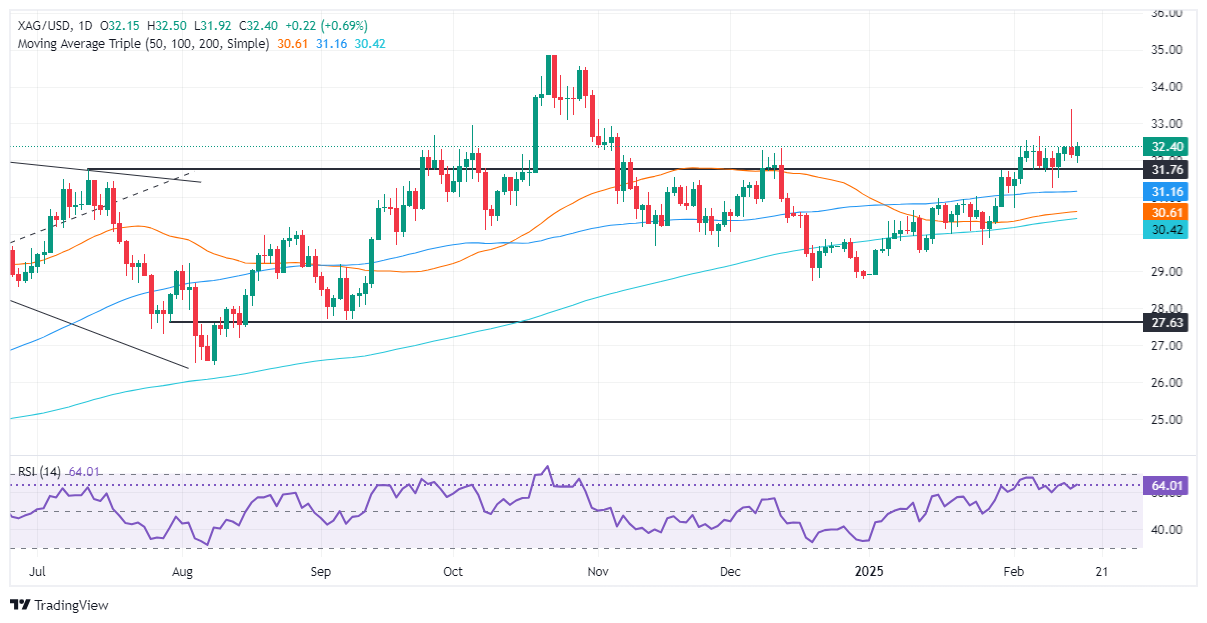
The grey metal shifted from neutral to upward biased, though a quick rejection candle printed on February 14 after hitting a three-month high of $33.39 could pave the way for further downside.
The Relative Strength Index (RSI) remains bullish, but it is worth noting that as XAG/USD spiked past $33.00, the RSI failed to record a higher high, indicating that a ‘negative divergence’ looms.
If Silver drops below the February 17 swing low of $31.92, the grey metal would be poised to test the 100-day Simple Moving Average (SMA) at $31.15. A breach of the latter will expose the 50 and 200-day SMAs, each at $30.60 and $30.42.
On the other hand, if XAG/USD rallies past $32.50, the psychological $33.00 mark would be the key resistance. Once surpassed, the year-to-date (YTD) high would be up next at $33.39.
XAG/USD Price Chart – Daily
Silver FAQs
Silver is a precious metal highly traded among investors. It has been historically used as a store of value and a medium of exchange. Although less popular than Gold, traders may turn to Silver to diversify their investment portfolio, for its intrinsic value or as a potential hedge during high-inflation periods. Investors can buy physical Silver, in coins or in bars, or trade it through vehicles such as Exchange Traded Funds, which track its price on international markets.
Silver prices can move due to a wide range of factors. Geopolitical instability or fears of a deep recession can make Silver price escalate due to its safe-haven status, although to a lesser extent than Gold's. As a yieldless asset, Silver tends to rise with lower interest rates. Its moves also depend on how the US Dollar (USD) behaves as the asset is priced in dollars (XAG/USD). A strong Dollar tends to keep the price of Silver at bay, whereas a weaker Dollar is likely to propel prices up. Other factors such as investment demand, mining supply – Silver is much more abundant than Gold – and recycling rates can also affect prices.
Silver is widely used in industry, particularly in sectors such as electronics or solar energy, as it has one of the highest electric conductivity of all metals – more than Copper and Gold. A surge in demand can increase prices, while a decline tends to lower them. Dynamics in the US, Chinese and Indian economies can also contribute to price swings: for the US and particularly China, their big industrial sectors use Silver in various processes; in India, consumers’ demand for the precious metal for jewellery also plays a key role in setting prices.
Silver prices tend to follow Gold's moves. When Gold prices rise, Silver typically follows suit, as their status as safe-haven assets is similar. The Gold/Silver ratio, which shows the number of ounces of Silver needed to equal the value of one ounce of Gold, may help to determine the relative valuation between both metals. Some investors may consider a high ratio as an indicator that Silver is undervalued, or Gold is overvalued. On the contrary, a low ratio might suggest that Gold is undervalued relative to Silver.
Recommended Articles


