

Silver Price Forecast: XAG/USD climbs amid safe-haven demand
- Silver shows resilience, finding support at the 200-day SMA of $30.08 amid the downtrend.
- To gain momentum, silver must surpass 50-day SMA at $30.28, targeting 100-day SMA at $30.99.
- Breaking above these SMAs could position silver to retest its December 2024 high of $32.32.
Silver prices advanced by 0.81% late in the North American session on Tuesday, as market participants seeking security bought precious metals like XAU and XAG, which are posting solid gains. XAG/USD trades at $30.42 a troy ounce at the time of writing.
XAG/USD Price Forecast: Technical outlook
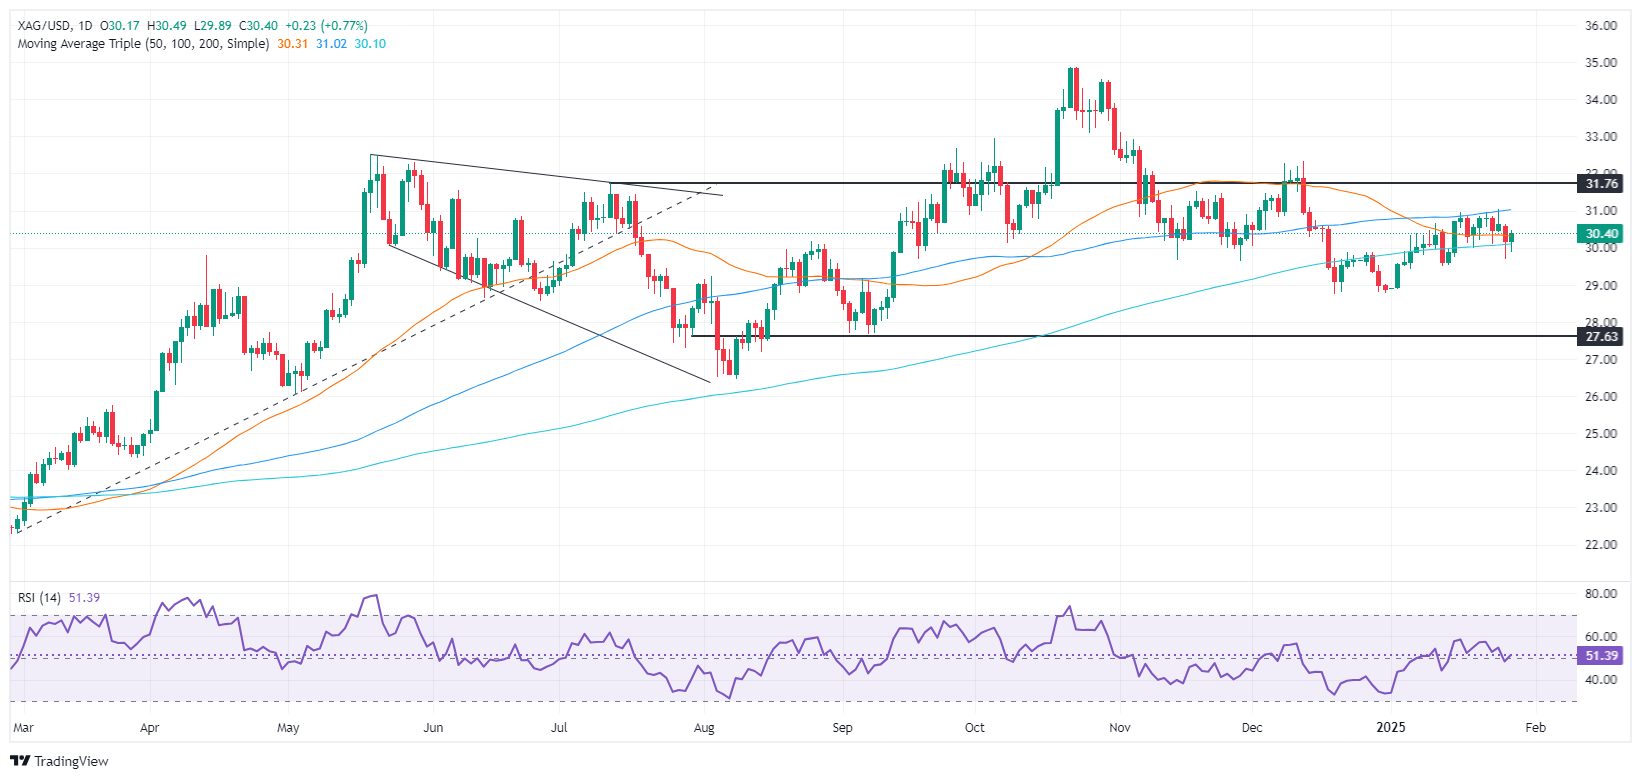
The daily chart suggests Silver is consolidated and found support at the 200-day Simple Moving Average (SMA) at $30.08. Although XAG/USD has carved successive series of lower highs and lower lows, hinting at a short-term downtrend, bears must clear the December 19 swing low of $28.74 to shift the bias downwards.
For a bullish continuation, XAG buyers must clear dynamic resistance at $30.28, where the 50-day SMA resides, followed by a challenge of the 100-day SMA at $30.99. Once those levels are taken out, bulls could challenge December’s 2024 peak at $32.32.
XAG/USD Price Chart – Daily
Silver FAQs
Silver is a precious metal highly traded among investors. It has been historically used as a store of value and a medium of exchange. Although less popular than Gold, traders may turn to Silver to diversify their investment portfolio, for its intrinsic value or as a potential hedge during high-inflation periods. Investors can buy physical Silver, in coins or in bars, or trade it through vehicles such as Exchange Traded Funds, which track its price on international markets.
Silver prices can move due to a wide range of factors. Geopolitical instability or fears of a deep recession can make Silver price escalate due to its safe-haven status, although to a lesser extent than Gold's. As a yieldless asset, Silver tends to rise with lower interest rates. Its moves also depend on how the US Dollar (USD) behaves as the asset is priced in dollars (XAG/USD). A strong Dollar tends to keep the price of Silver at bay, whereas a weaker Dollar is likely to propel prices up. Other factors such as investment demand, mining supply – Silver is much more abundant than Gold – and recycling rates can also affect prices.
Silver is widely used in industry, particularly in sectors such as electronics or solar energy, as it has one of the highest electric conductivity of all metals – more than Copper and Gold. A surge in demand can increase prices, while a decline tends to lower them. Dynamics in the US, Chinese and Indian economies can also contribute to price swings: for the US and particularly China, their big industrial sectors use Silver in various processes; in India, consumers’ demand for the precious metal for jewellery also plays a key role in setting prices.
Silver prices tend to follow Gold's moves. When Gold prices rise, Silver typically follows suit, as their status as safe-haven assets is similar. The Gold/Silver ratio, which shows the number of ounces of Silver needed to equal the value of one ounce of Gold, may help to determine the relative valuation between both metals. Some investors may consider a high ratio as an indicator that Silver is undervalued, or Gold is overvalued. On the contrary, a low ratio might suggest that Gold is undervalued relative to Silver.
Recommended Articles


