

Silver Price Analysis: XAG/USD explodes above $80 as rally extends

- Gold Price Forecast: Oil Price Breaking $100 Fuels Inflation Concerns, Will Gold Prices Fall Further?
- Gold Price Trend Forecast: Expectations of Easing US-Iran Tensions Boost Gold Prices, $4,070 Becomes Key Level for Bulls and Bears
- Gold rallies to over two-week high, eyes $4,150 as traders track US-Iran diplomacy efforts
- Euro declines to near 1.1400 as US launches fresh strikes on Iran
- Tesla Q2 Earnings Preview: Record Deliveries Fail to Hide Profit Pressure, Can Musk Rely on AI and Autonomous Driving to Unlock New Growth Space?
- WTI climbs above $87.00 as Middle East conflict threatens key choke points

XAG/USD surges over 5% to fresh YTD highs as geopolitical tensions, weaker US jobs outlook fuel aggressive buying.
RSI enters overbought territory, yet momentum remains strong, keeping the upside bias firmly intact.
A break above $81.44 opens $82.00 and $85.87, while $80.00 is key downside support.
Silver (XAG/USD) continues to rise parabolically, up more than 5%, trading above the $80.00 threshold a troy ounce, despite rising US Treasury yields and a strong US Dollar.
Geopolitics continued to drive the precious metals segment higher. This and increasing bets that the Federal Reserve will resume its easing cycle during the year sparked by weakness in the jobs market, pushing the grey’s metal to a new year-to-date (YTD) high of $81.43.
XAG/USD Price Analysis: Technical outlook
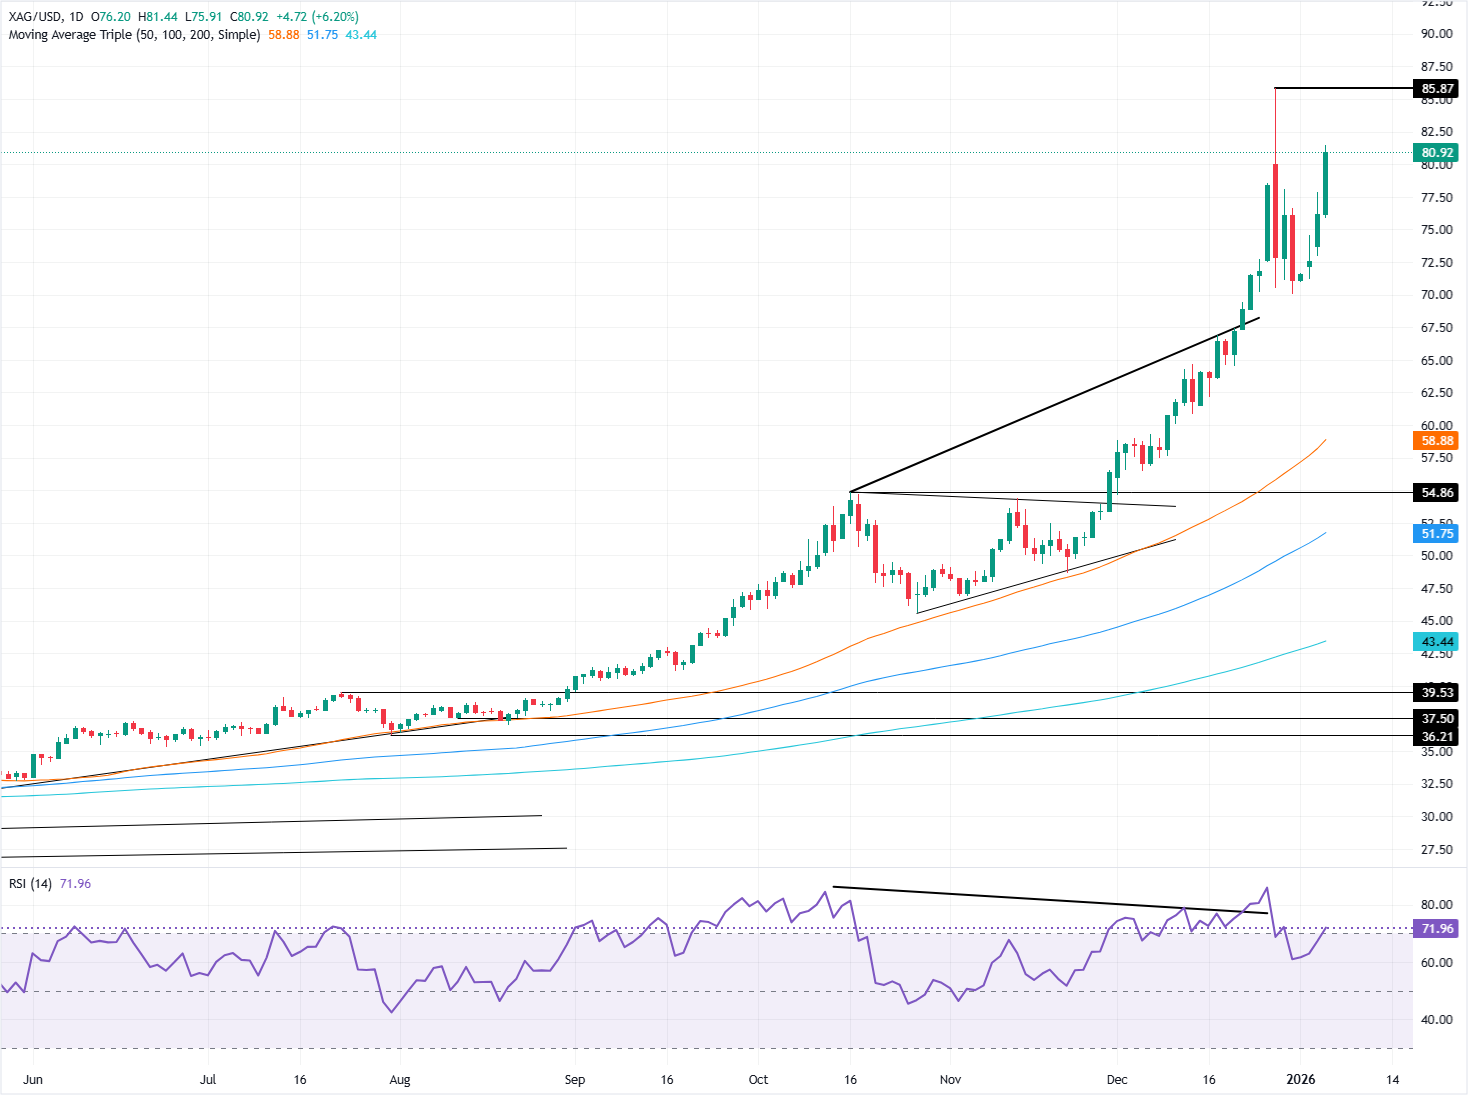
Silver’s technical picture indicates that bulls continued to control the narrative, while the Relative Strength Index (RSI) turns overbought. Nevertheless, as the RSI crosses the 70 level, it’s worth nothing that due to the strength of the move, XAG/USD is not as overbought as shown by the RSI.
If the RSI crosses above 80, then Silver could be considered overbought, but so far it seems that the trend is overextended, subject to a retracement. However, the path of least resistance is upwards.
The first key resistance is the day’s high of $81.44. Once surpassed, the next stop would be the $82.00 mark ahead of the all-time high at $85.87. Conversely, if XAG/USD dives below $80.00, this could exacerbate a pullback, with the January 5 high at $77.88, being the first support level. Once cleared, the next stop would be $75.00.
XAG/USD Price Chart – Daily
Read more
* The content presented above, whether from a third party or not, is considered as general advice only. This article should not be construed as containing investment advice, investment recommendations, an offer of or solicitation for any transactions in financial instruments.


