

Silver Price Forecast: XAG/USD falls but clings to $31.00

Source Fxstreet
  • Silver prices decline as a risk-on mood and weak Chinese economic data weigh on the precious metal.
  • Momentum favors buyers, but caution is warranted with the RSI showing signs of weakening.
  • Key resistance lies at $31.63, with bulls aiming for $32.00 and the year-to-date high of $32.95. A break below $31.00 could target support at $30.76 and $30.12.

Silver's price dropped during the North American session on Monday, courtesy of a broad risk-on mood. China’s economy remains weak despite government efforts to stimulate consumer spending. Therefore, the XAG/USD trades at $31.25, down by over 0.88%.

XAG/USD Price Forecast: Technical outlook

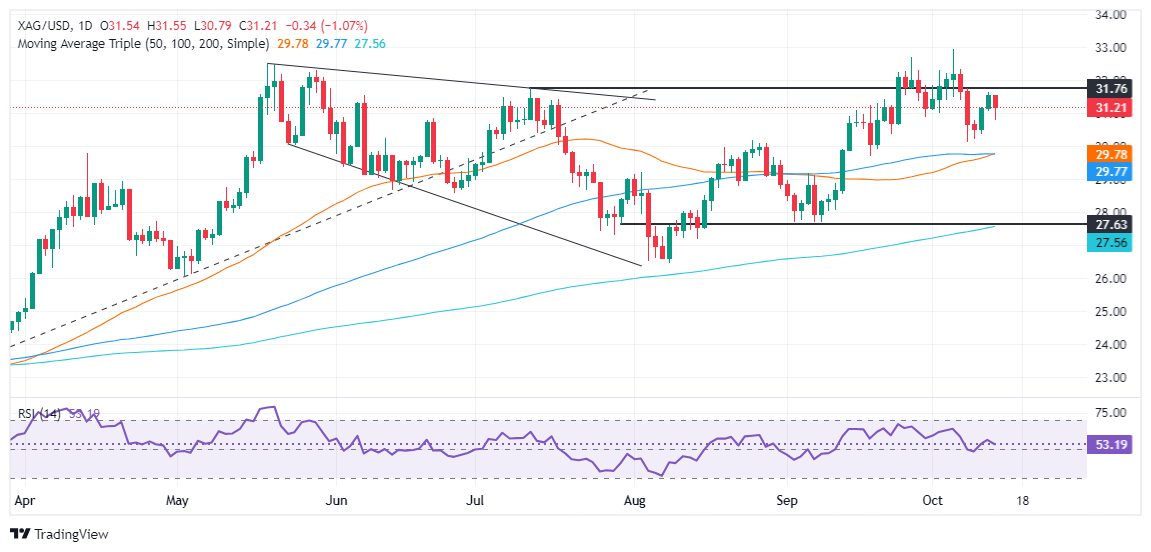
After edging higher for two consecutive days, the XAG/USD has retreated somewhat, yet it remains above the $31.00 figure.

Momentum favors buyers in the near term, as shown by the Relative Strength Index (RSI), though caution is warranted, as RSI peaked below the latest two troughs.

For XAG/USD to resume its uptrend, bulls must clear the October 11 high at $31.63. If surpassed, the next stop would be the $32.00 figure, followed by the May 29 high at $32.29 and the May 20 at $32.50. Up next would be the year-to-date (YTD) high at $32.95.

Conversely, if sellers move in, the first support would be the $31.00 mark, followed by today’s low of $30.76. Once surpassed, the next stop would be the October 8 low of $30.12, followed by the confluence of the 50-100-day moving averages (DMAs) at $29.75/74.

XAG/USD Price Action – Daily Chart
Silver FAQs

Silver is a precious metal highly traded among investors. It has been historically used as a store of value and a medium of exchange. Although less popular than Gold, traders may turn to Silver to diversify their investment portfolio, for its intrinsic value or as a potential hedge during high-inflation periods. Investors can buy physical Silver, in coins or in bars, or trade it through vehicles such as Exchange Traded Funds, which track its price on international markets.

Silver prices can move due to a wide range of factors. Geopolitical instability or fears of a deep recession can make Silver price escalate due to its safe-haven status, although to a lesser extent than Gold's. As a yieldless asset, Silver tends to rise with lower interest rates. Its moves also depend on how the US Dollar (USD) behaves as the asset is priced in dollars (XAG/USD). A strong Dollar tends to keep the price of Silver at bay, whereas a weaker Dollar is likely to propel prices up. Other factors such as investment demand, mining supply – Silver is much more abundant than Gold – and recycling rates can also affect prices.

Silver is widely used in industry, particularly in sectors such as electronics or solar energy, as it has one of the highest electric conductivity of all metals – more than Copper and Gold. A surge in demand can increase prices, while a decline tends to lower them. Dynamics in the US, Chinese and Indian economies can also contribute to price swings: for the US and particularly China, their big industrial sectors use Silver in various processes; in India, consumers’ demand for the precious metal for jewellery also plays a key role in setting prices.

Silver prices tend to follow Gold's moves. When Gold prices rise, Silver typically follows suit, as their status as safe-haven assets is similar. The Gold/Silver ratio, which shows the number of ounces of Silver needed to equal the value of one ounce of Gold, may help to determine the relative valuation between both metals. Some investors may consider a high ratio as an indicator that Silver is undervalued, or Gold is overvalued. On the contrary, a low ratio might suggest that Gold is undervalued relative to Silver.


Disclaimer: For information purposes only. Past performance is not indicative of future results.
placeholder
October hike odds climb toward 60% as Goldman and BofA both flip — what Warsh's "dose of accommodation" really changedRate futures now price roughly 55% to 62% for a 25bp hike at the October 27-28 FOMC, up from about 30% before Chair Warsh's post-meeting framing that the Fed is merely "removing some accommodation." Goldman Sachs has added an October hike to its forecast and Bank of America now sees moves in both October and December. Here is the repricing, the language behind it, and the two data points that decide it.
Author  Irene Q.
Sep 23, Wed
Rate futures now price roughly 55% to 62% for a 25bp hike at the October 27-28 FOMC, up from about 30% before Chair Warsh's post-meeting framing that the Fed is merely "removing some accommodation." Goldman Sachs has added an October hike to its forecast and Bank of America now sees moves in both October and December. Here is the repricing, the language behind it, and the two data points that decide it.
placeholder
US input costs rose at the fastest pace in four years — the September flash PMI beat is an inflation story, not a growth storyUS September flash PMIs came in far above expectations, with the composite at 58.4, a five-year high. But the detail that moved markets was input cost inflation at its fastest since October 2022, driven by fuel, transport and supply shortages. Brent is back above $100 and the 10-year Treasury yield has hit its highest since 2007.
Author  Suzie
Sep 24, Thu
US September flash PMIs came in far above expectations, with the composite at 58.4, a five-year high. But the detail that moved markets was input cost inflation at its fastest since October 2022, driven by fuel, transport and supply shortages. Brent is back above $100 and the 10-year Treasury yield has hit its highest since 2007.
placeholder
Brent edges toward $99 as Trump rejects Iran's Hormuz proposal — why the war-risk premium won't rebuildBrent crude rose 0.92% to $98.51 and WTI gained 1.15% to $93.51 after President Trump rejected Iran's seven-day proposal to reopen the Strait of Hormuz. But both benchmarks remain about 12% below their early-September highs, because supply never actually stopped. Hormuz flows ran at 33.7 million barrels this week, in line with the prior week, and Saudi Arabia's East-West pipeline restarted on September 22.
Author  Suzie
18 hours ago
Brent crude rose 0.92% to $98.51 and WTI gained 1.15% to $93.51 after President Trump rejected Iran's seven-day proposal to reopen the Strait of Hormuz. But both benchmarks remain about 12% below their early-September highs, because supply never actually stopped. Hormuz flows ran at 33.7 million barrels this week, in line with the prior week, and Saudi Arabia's East-West pipeline restarted on September 22.
placeholder
Four jobs reports in five days: what JOLTS, ADP, claims and the September payrolls mean for the October Fed decisionThe US labour market faces its densest data week of the month. JOLTS job openings land Tuesday (7.2 million expected), ADP on Wednesday (70,000 expected), initial claims on Thursday and the September non-farm payrolls on Friday (100,000 expected, down from 162,000). Markets price a 64%-70% chance of another quarter-point Fed hike on October 28. The dollar index sits at 100.77 and the S&P 500 at 7,729.8.
Author  Mitrade
18 hours ago
The US labour market faces its densest data week of the month. JOLTS job openings land Tuesday (7.2 million expected), ADP on Wednesday (70,000 expected), initial claims on Thursday and the September non-farm payrolls on Friday (100,000 expected, down from 162,000). Markets price a 64%-70% chance of another quarter-point Fed hike on October 28. The dollar index sits at 100.77 and the S&P 500 at 7,729.8.
placeholder
Gold Falls Below $4,200 in Single-Day Drop of Over $100: Why Are Gold Prices Plunging? As of the Asian session on September 28, international gold prices continued their recent weakness, with spot gold (XAUUSD) falling below $4,200 intraday to a low of $4,179.42, down over
Author  TradingKey
15 hours ago
As of the Asian session on September 28, international gold prices continued their recent weakness, with spot gold (XAUUSD) falling below $4,200 intraday to a low of $4,179.42, down over
Related Instrument
goTop
quote