Gold returns to familiar range after weak US jobs data

Source Fxstreet
  • Gold recovers after the release of worst-than-expected US Jobless Claims data. 
  • Despite higher inflation data suggesting interest rates might remain high, the jobs data indicates the opposite.
  • Technically, XAU/USD returns to its range-bound mode as it unfolds a leg back higher. 

Gold (XAU/USD) recovers to trade back in the $2,630s on Friday as subpar United States (US) jobs data cements expectations that the Federal Reserve (Fed) will cut interest rates at their November policy meeting. The anticipation of interest rates falling is bullish for Gold as such an occurrence would reduce the opportunity cost of holding the non-interest-paying asset, making it more attractive to investors. 

Gold rallies after US jobs data

Gold rebounded from just above the key $2,600 psychological level on Thursday after the release of official US Jobless Claims data showed a surprising spike in the number of people claiming unemployment benefits. US Treasury yields dipped after the release, the US Dollar (USD) marginally weakened and Gold got a lift.

US Initial Jobless Claims in the week ending October 4 rose by 258K, above the 225K of the previous week and expectations of 230K, data from the US Bureau of Labor Statistics (BLS) showed. The rise in initial claims was well above the average, although this might have been caused by the exodus from Florida ahead of the impact of Hurricane Milton, according to Bloomberg News. 

Continuing Claims for the week ending September 27 rose to 1.861 million, higher than the revised-down 1.819M  of the previous week and roundly above the 1.830M estimate. 

Overall, the data showed weakness creeping into the jobs market, which is likely to keep the Fed on track to cut interest rates (in order to stimulate borrowing and job creation) at its November policy meeting. In August, Fed Chairman Jerome Powell signaled he was shifting his focus from inflation to the Fed’s other mandate: “full employment”.  

Although the market-based probability of the Fed lowering its fed funds rate by 50 basis points (bps) (0.50%) remained at zero after the release, the chances of a smaller 25 bps (0.25%) cut rose to 89% from 85% before the jobs’ data, according to the CME Fedwatch tool. The probability of the Fed leaving its key interest rate unchanged in November fell to 11% from 15%. These probabilities have since reverted to 85% for 25 bps and 15% for no-change.

Higher-than-expected inflation data, as measured by the Consumer Price Index (CPI) for September, released at the same time as the Jobless Claims’ data, failed to act as a counter-weight.  Headline CPI climbed 2.4% year-over-year (YoY) from 2.3% previously, and core CPI rose 3.3% YoY from 3.2% previously. The higher inflation would normally be expected to increase bets of the Fed keeping interest rates unchanged to continue the fight against stubbornly high inflation, however, this was not the case on Thursday. This was probably due to the Fed’s new prioritization of employment. 

Gold has recently gained a further backdraught from the speeches of Fed policymakers.  A long list of officials commented on the outlook for monetary policy on Wednesday, and all were assessed as either neutral or dovish according to the FXStreet FedTracker, a new AI-powered tool that gauges the tone of Fed officials’ speeches on a dovish-to-hawkish scale from 0 to 10. 

More US inflation data is set to be released on Friday in the form of “factory gate” inflation figures for September, or the Producer Price Index (PPI). However, judging from the lack of reaction to the CPI data, any impact on Gold is likely to be muted unless it diverges in a sizeable way from forecasts. The US Michigan Consumer Sentiment survey is another major release on Friday that could impact Gold. 

Gold could also be gaining due to attracting safe-haven flows amid elevated geopolitical tensions. Israel has stepped up its bombing of Hezbollah targets in Lebanon, causing substantial collateral damage, and investors remain on tenterhooks about the scale of Israel’s almost certain retaliation against Iran. 

Technical Analysis: Gold returns to familiar range

Gold flips its short-term downtrend and rises back up into its familiar range above $2,625 after bottoming out at the $2,600 psychological level. 

XAU/USD 4-hour Chart


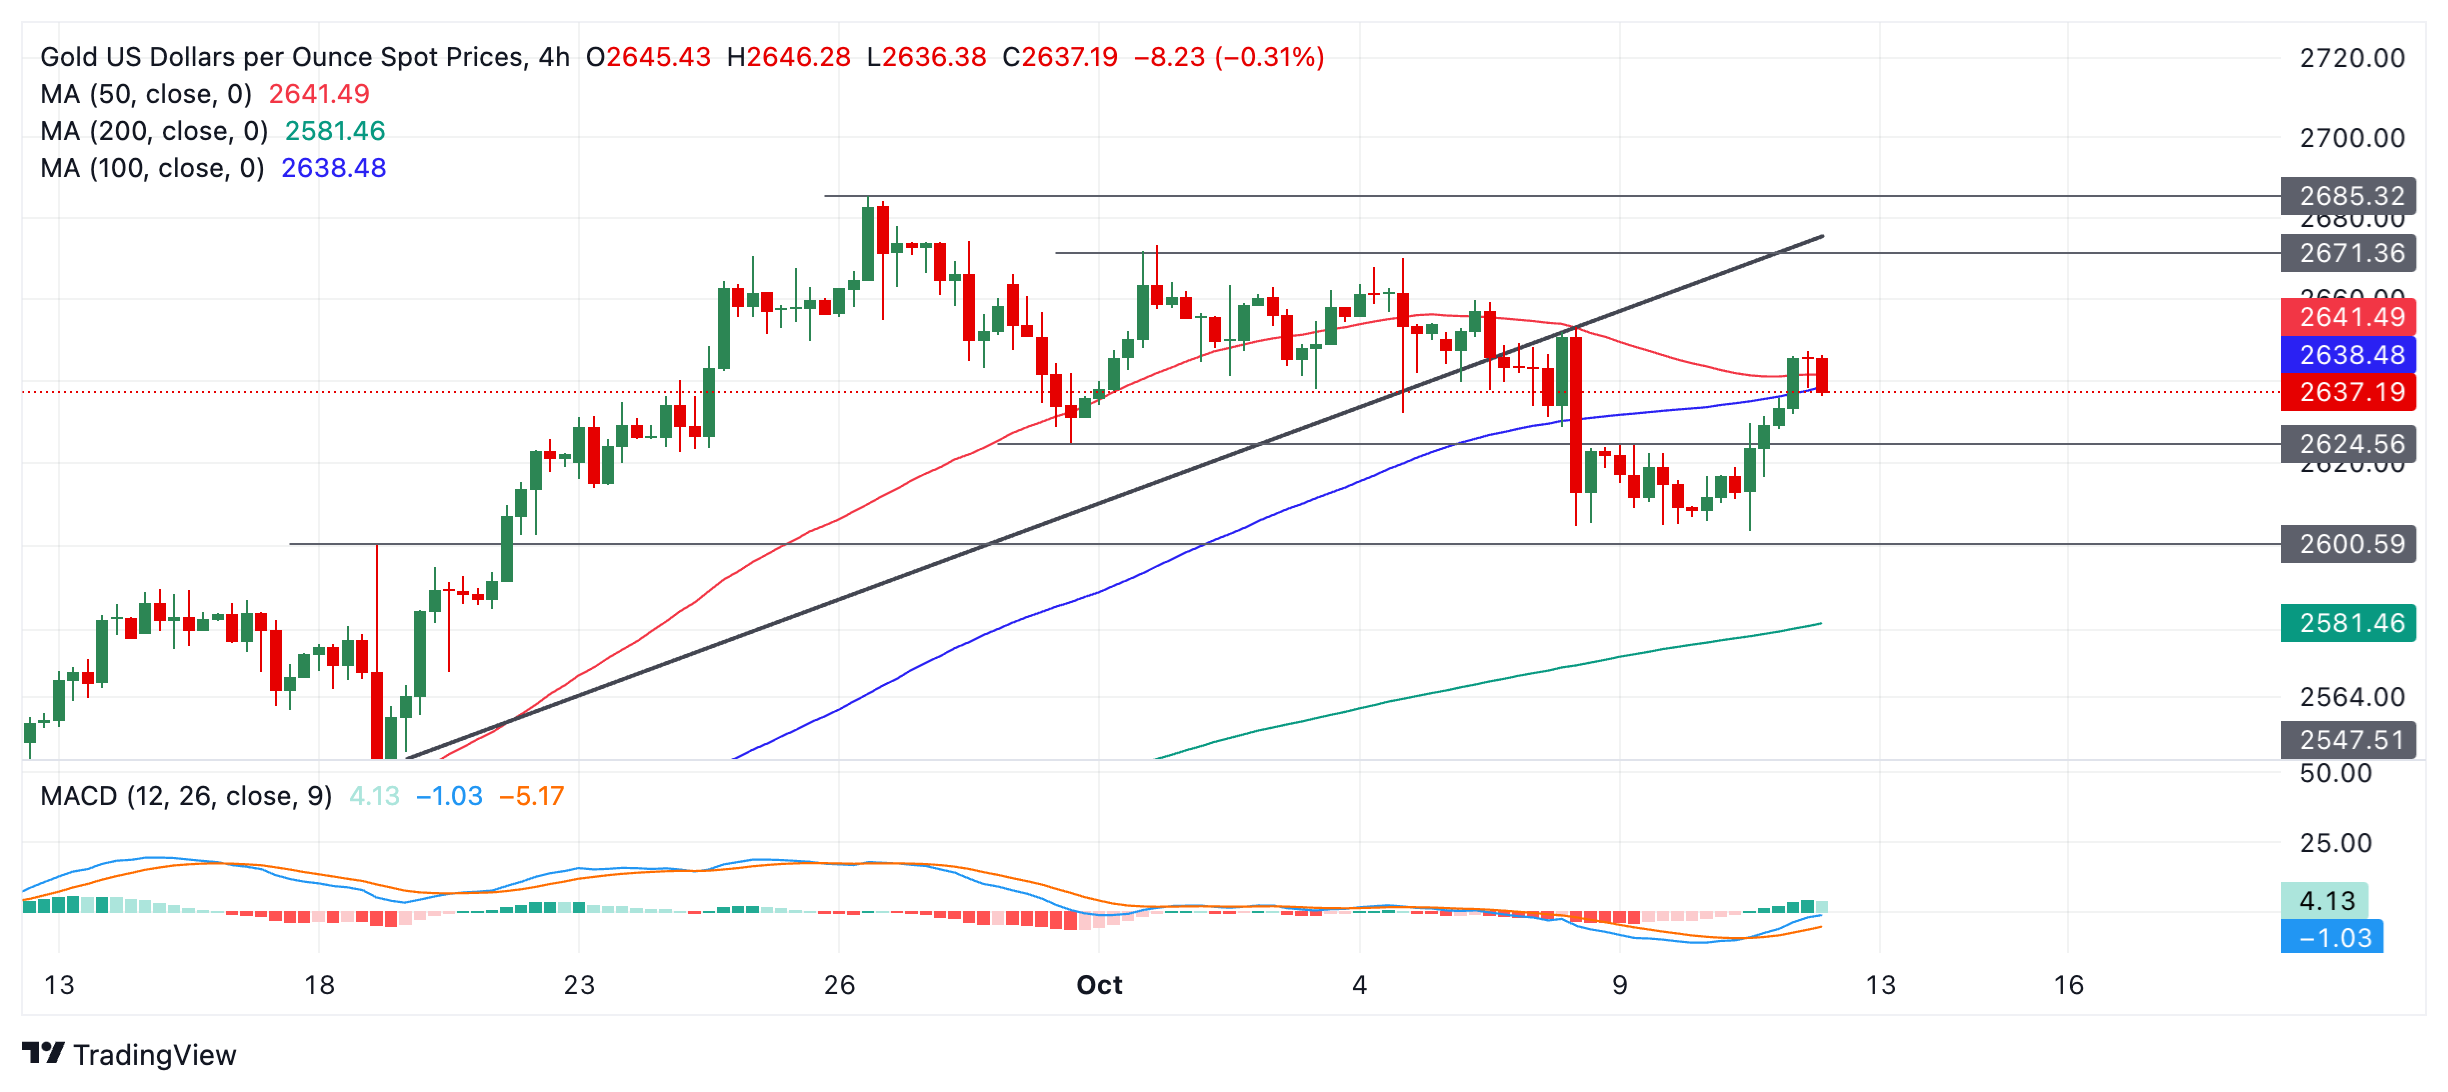
The short-term trend has probably switched back to sideways, and given the technical analysis principle that “the trend is your friend,” the odds favor a continuation in the near term. This will likely see Gold continue its up-leg towards the old range ceiling at $2,670. A break above $2,653 (October 8 high) would provide more confirmation such a leg was evolving. Following that, Gold might unfold a leg back down to the range floor as it continues oscillating. 

Gold’s medium and long-term trends remain bullish, however, and if one of these longer-term cycles resumes, it could, in theory, push the asset to even higher highs.

Economic Indicator

Initial Jobless Claims

The Initial Jobless Claims released by the US Department of Labor is a measure of the number of people filing first-time claims for state unemployment insurance. A larger-than-expected number indicates weakness in the US labor market, reflects negatively on the US economy, and is negative for the US Dollar (USD). On the other hand, a decreasing number should be taken as bullish for the USD.

Read more.

Last release: Thu Oct 10, 2024 12:30

Frequency: Weekly

Actual: 258K

Consensus: 230K

Previous: 225K

Source: US Department of Labor

Every Thursday, the US Department of Labor publishes the number of previous week’s initial claims for unemployment benefits in the US. Since this reading could be highly volatile, investors may pay closer attention to the four-week average. A downtrend is seen as a sign of an improving labour market and could have a positive impact on the USD’s performance against its rivals and vice versa.


Disclaimer: For information purposes only. Past performance is not indicative of future results.
placeholder
Gold Price Forecast: XAU/USD drifts higher above $4,200 as Fed delivers expected cutGold price (XAU/USD) gains momentum to around $4,235 during the early Asian session on Thursday. The precious metal extends its upside after the US Federal Reserve (Fed) delivered an expected third consecutive interest rate cut and maintained its outlook for just one cut in 2026.
Author  FXStreet
Dec 11, Thu
Gold price (XAU/USD) gains momentum to around $4,235 during the early Asian session on Thursday. The precious metal extends its upside after the US Federal Reserve (Fed) delivered an expected third consecutive interest rate cut and maintained its outlook for just one cut in 2026.
placeholder
Gold remains bid as lack of Fed clarity and geopolitical frictions persistGold (XAU/USD) advances modestly on Friday as traders seem to book profits ahead of the weekend, yet clings to gains of over 0.51% after reaching a seven-week high of $4,353. At the time of writing, XAU/USD trades at $4,302 as traders digest comments from Federal Reserve (Fed) officials.
Author  FXStreet
Yesterday 01: 34
Gold (XAU/USD) advances modestly on Friday as traders seem to book profits ahead of the weekend, yet clings to gains of over 0.51% after reaching a seven-week high of $4,353. At the time of writing, XAU/USD trades at $4,302 as traders digest comments from Federal Reserve (Fed) officials.
placeholder
Ethereum Price Slips Lower — $3,000 Looms as the Key BattlegroundEthereum is attempting to recover from a $3,026 low but remains below $3,200 and the 100-hour SMA, with a bearish trend line near $3,175 capping rebounds as bulls need a clean break above $3,200 to target $3,250–$3,400, while a drop below $3,050 risks a retest of $3,000 and $2,940.
Author  Mitrade
Yesterday 03: 25
Ethereum is attempting to recover from a $3,026 low but remains below $3,200 and the 100-hour SMA, with a bearish trend line near $3,175 capping rebounds as bulls need a clean break above $3,200 to target $3,250–$3,400, while a drop below $3,050 risks a retest of $3,000 and $2,940.
placeholder
Macro Analysts: Hawkish Japan Could Push Bitcoin Below $70KAnalysts predict Bitcoin may face further declines towards the $70,000 mark if the Bank of Japan raises interest rates as expected.
Author  Mitrade
Yesterday 05: 48
Analysts predict Bitcoin may face further declines towards the $70,000 mark if the Bank of Japan raises interest rates as expected.
placeholder
Bitcoin Slides 5% as Sellers Lean In — Can BTC Reclaim $88,000?Bitcoin has dropped back below $88,000 after rolling over from $90,500, with price still trading under the 100-hour Simple Moving Average. The sell-off found a floor at $85,151, and BTC is now consolidating near that base, but rebounds are facing pressure from a bearish trend line around $89,000. Bulls need to retake $88,000–$89,000 to ease downside risk; failure to do so keeps $85,500–$85,000 and then $83,500 in play, with $80,000 as the deeper “line in the sand.” Bitcoin (BTC) is back in damage-control mode after a sharp pullback wiped out recent gains. The price failed to reclaim the $90,000–$90,500 band, rolled over, and slid through $88,500 before briefly dipping under $87,000. Buyers did show up around $85,000, but the rebound so far looks more like stabilization than a clear trend reversal. Bitcoin dips hard, finds a bid near $85,000(h3) BTC’s latest move lower began when it couldn’t build follow-through above $90,000 and $90,500. Once that upside stalled, sellers took control and pushed price down through $88,500. The slide accelerated enough to spike below $87,000, but the market didn’t free-fall. Bulls defended the $85,000 zone, printing a low at $85,151. Since then, Bitcoin has been consolidating below the 23.6% Fibonacci retracement of the drop from the $93,560 swing high to the $85,151 low — a clue that the bounce is still shallow and that sellers haven’t fully backed off yet. Structurally, BTC is still on the back foot: It’s trading below $88,000, and It remains below the 100-hour Simple Moving Average, keeping short-term trend pressure pointed downward. Resistance is layered, and $89,000 is the problem area(h3) If bulls try to turn this into a recovery, they’ll have to climb through multiple ceilings in quick succession. First, BTC faces resistance around $87,150, followed by a more meaningful barrier near $87,500. From there, the market’s attention snaps back to $88,000 — the level BTC just lost and now needs to reclaim. A close back above $88,000 would improve the tone, but it doesn’t solve the bigger issue: there’s a bearish trend line on the hourly BTC/USD chart (Kraken feed) with resistance near $89,000, which also lines up with the next technical hurdle. If BTC can push through $89,000 and hold, the rebound could extend toward $90,000, with follow-through targets at $91,000 and $91,500. But until price clears that $88,000–$89,000 zone, rallies are at risk of being sold rather than chased. If BTC fails to reclaim resistance, the downside path is clear(h3) The near-term bear case is simple: if Bitcoin can’t climb back above the $87,000 area and keep traction, sellers may attempt another leg lower. Support levels line up like this: Immediate support: $85,500 First major support: $85,000 Next support: $83,500 Then $82,500 in the near term Below that, the major “don’t break this” level is still $80,000. If BTC slips under $80,000, the risk of acceleration to the downside increases significantly — not because it’s magic, but because it’s the kind of psychological and structural level that tends to trigger forced de-risking. Indicators: momentum still leans bearish(h3) The intraday indicators aren’t offering much comfort yet: Hourly MACD is losing pace in the bearish zone. Hourly RSI remains below 50, suggesting sellers still have the upper hand on short timeframes. So while the $85,000 defense held for now, the market hasn’t flipped bullish — it’s just stopped bleeding.
Author  Mitrade
9 hours ago
Bitcoin has dropped back below $88,000 after rolling over from $90,500, with price still trading under the 100-hour Simple Moving Average. The sell-off found a floor at $85,151, and BTC is now consolidating near that base, but rebounds are facing pressure from a bearish trend line around $89,000. Bulls need to retake $88,000–$89,000 to ease downside risk; failure to do so keeps $85,500–$85,000 and then $83,500 in play, with $80,000 as the deeper “line in the sand.” Bitcoin (BTC) is back in damage-control mode after a sharp pullback wiped out recent gains. The price failed to reclaim the $90,000–$90,500 band, rolled over, and slid through $88,500 before briefly dipping under $87,000. Buyers did show up around $85,000, but the rebound so far looks more like stabilization than a clear trend reversal. Bitcoin dips hard, finds a bid near $85,000(h3) BTC’s latest move lower began when it couldn’t build follow-through above $90,000 and $90,500. Once that upside stalled, sellers took control and pushed price down through $88,500. The slide accelerated enough to spike below $87,000, but the market didn’t free-fall. Bulls defended the $85,000 zone, printing a low at $85,151. Since then, Bitcoin has been consolidating below the 23.6% Fibonacci retracement of the drop from the $93,560 swing high to the $85,151 low — a clue that the bounce is still shallow and that sellers haven’t fully backed off yet. Structurally, BTC is still on the back foot: It’s trading below $88,000, and It remains below the 100-hour Simple Moving Average, keeping short-term trend pressure pointed downward. Resistance is layered, and $89,000 is the problem area(h3) If bulls try to turn this into a recovery, they’ll have to climb through multiple ceilings in quick succession. First, BTC faces resistance around $87,150, followed by a more meaningful barrier near $87,500. From there, the market’s attention snaps back to $88,000 — the level BTC just lost and now needs to reclaim. A close back above $88,000 would improve the tone, but it doesn’t solve the bigger issue: there’s a bearish trend line on the hourly BTC/USD chart (Kraken feed) with resistance near $89,000, which also lines up with the next technical hurdle. If BTC can push through $89,000 and hold, the rebound could extend toward $90,000, with follow-through targets at $91,000 and $91,500. But until price clears that $88,000–$89,000 zone, rallies are at risk of being sold rather than chased. If BTC fails to reclaim resistance, the downside path is clear(h3) The near-term bear case is simple: if Bitcoin can’t climb back above the $87,000 area and keep traction, sellers may attempt another leg lower. Support levels line up like this: Immediate support: $85,500 First major support: $85,000 Next support: $83,500 Then $82,500 in the near term Below that, the major “don’t break this” level is still $80,000. If BTC slips under $80,000, the risk of acceleration to the downside increases significantly — not because it’s magic, but because it’s the kind of psychological and structural level that tends to trigger forced de-risking. Indicators: momentum still leans bearish(h3) The intraday indicators aren’t offering much comfort yet: Hourly MACD is losing pace in the bearish zone. Hourly RSI remains below 50, suggesting sellers still have the upper hand on short timeframes. So while the $85,000 defense held for now, the market hasn’t flipped bullish — it’s just stopped bleeding.
goTop
quote